Download
1 / 1
10 likes | 99 Views
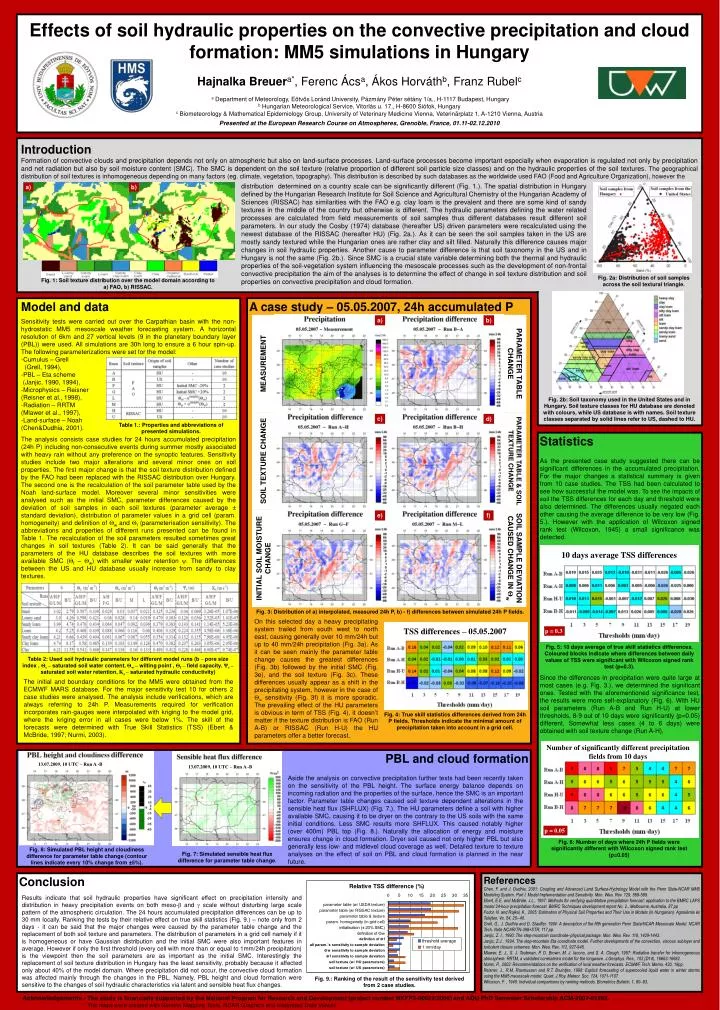
a). b). Fig. 2a: Distribution of soil samples across the soil textural triangle. Fig. 1 : Soil texture distribution over the model domain according to a) FAO , b) RISSAC. a). b). PARAMETER TABLE CHANGE. MEASUREMENT. c). d).

E N D
a) b) Fig. 2a: Distribution of soil samples across the soil textural triangle. Fig. 1: Soil texture distribution over the model domain according to a) FAO, b) RISSAC. a) b) PARAMETER TABLE CHANGE MEASUREMENT c) d) Table 1.: Properties and abbreviations of presented simulations. SOIL TEXTURE CHANGE PARAMETER TABLE & SOIL TEXTURE CHANGE e) f) 10 days average TSS differences INITIAL SOIL MOISTURE CHANGE SOIL SAMPLE DEVIATION CAUSED CHANGE IN Θw TSS differences – 05.05.2007 Fig. 5: 10 days average of true skill statistics differences. Coloured blocks indicate where differences between daily values of TSS were significant with Wilcoxon signed rank test (p=0.3). Number of significantly different precipitation fields from 10 days Fig. 6: Number of days where 24h P fields were significantly different with Wilcoxon signed rank test (p=0.05) p = 0.05 Effects of soil hydraulic properties on the convective precipitation and cloud formation: MM5 simulations in Hungary Hajnalka Breuera*, Ferenc Ácsa, Ákos Horváthb, Franz Rubelc a Department of Meteorology, Eötvös Loránd University, Pázmány Péter sétány 1/a., H-1117 Budapest, Hungary b Hungarian Meteorological Service, Vitorlás u. 17., H-8600 Siófok, Hungary c Biometeorology & Mathematical Epidemiology Group, University of Veterinary Medicine Vienna, Veterinärplatz 1, A-1210 Vienna, Austria Presented at the European Research Course on Atmospheres, Grenoble, France, 01.11-02.12.2010 Introduction Formation of convective clouds and precipitation depends not only on atmospheric but also on land-surface processes. Land-surface processes become important especially when evaporation is regulated not only by precipitation and net radiation but also by soil moisture content (SMC). The SMC is dependent on the soil texture (relative proportion of different soil particle size classes) and on the hydraulic properties of the soil textures. The geographicaldistribution of soil textures is inhomogeneous depending on many factors (eg. climate, vegetation, topography). This distribution is described by such databases as the worldwide used FAO (Food and Agriculture Organization), howeverthe distribution determined on a country scale can be significantly different (Fig. 1.). The spatial distribution in Hungary defined by the Hungarian Research Institute for Soil Science and Agricultural Chemistry of the Hungarian Academy of Sciences (RISSAC) has similarities with the FAO e.g. clay loam is the prevalent and there are some kind of sandy textures in the middle of the country but otherwise is different. The hydraulic parameters defining the water related processes are calculated from field measurements of soil samples thus different databases result different soil parameters. In our study the Cosby (1974) database (hereafter US) driven parameters were recalculated using the newest database of the RISSAC (hereafter HU) (Fig. 2a.). As it can be seen the soil samples taken in the US are mostly sandy textured while the Hungarian ones are rather clay and silt filled. Naturally this difference causes major changes in soil hydraulic properties. Another cause to parameter difference is that soil taxonomy in the US and in Hungary is not the same (Fig. 2b.). Since SMC is a crucial state variable determining both the thermal and hydraulic properties of the soil-vegetation system influencing the mesoscale processes such as the development of non-frontal convective precipitation the aim of the analyses is to determine the effect of change in soil texture distribution and soil properties on convective precipitation and cloud formation. Table 2: Used soil hydraulic parameters for different model runs (b – pore size index , Θs – saturated soil water content, Θw – wilting point , Θf – field capacity, Ψs – saturated soil water retention, Ks – saturated hydraulic conductivity) A casestudy – 05.05.2007, 24h accumulated P Model and data Sensitivity tests were carried out over the Carpathian basin with the non-hydrostatic MM5 mesoscale weather forecasting system. A horizontal resolution of 6km and 27 vertical levels (9 in the planetary boundary layer (PBL)) were used. All simulations are 30h long to ensure a 6 hour spin-up. The following parameterizations were set for the model: -Cumulus – Grell (Grell, 1994), -PBL – Eta scheme (Janjic, 1990, 1994), -Microphysics – Reisner (Reisner et al., 1998), -Radiation – RRTM (Mlawer et al., 1997), -Land-surface – Noah (Chen&Dudhia, 2001). The analysis consists case studies for 24 hours accumulated precipitation (24h P) including non-consecutive events during summer mostly associated with heavy rain without any preference on the synoptic features. Sensitivity studies include two major alterations and several minor ones on soil properties. The first major change is that the soil texture distribution defined by the FAO had been replaced with the RISSAC distribution over Hungary. The second one is the recalculation of the soil parameter table used by the Noah land-surface model. Moreover several minor sensitivities were analysed such as the initial SMC, parameter differences caused by the deviation of soil samples in each soil textures (parameter average ± standard deviation), distribution of parameter values in a grid cell (param. homogeneity) and definition of Θw and Θf (parameterisation sensitivity). The abbreviations and properties of different runs presented can be found in Table 1. The recalculation of the soil parameters resulted sometimes great changes in soil textures (Table 2). It can be said generally that the parameters of the HU database describes the soil textures with more available SMC (Θf – Θw) with smaller water retention ψ. The differences between the US and HU database usually increase from sandy to clay textures. Fig. 2b: Soil taxonomy used in the United States and in Hungary. Soil texture classes for HU database are denoted with colours, while US database is with names. Soil texture classes separated by solid lines refer to US, dashed to HU. Statistics As the presented case study suggested there can be significant differences in the accumulated precipitation. For the major changes a statistical summary is given from 10 case studies. The TSS had been calculated to see how successful the model was. To see the impacts of soil the TSS differences for each day and threshold were also determined. The differences usually negated each other causing the average difference to be very low (Fig. 5.). However with the application of Wilcoxon signed rank test (Wilcoxon, 1945) a small significance was detected. Since the differences in precipitation were quite large at most cases (e.g. Fig. 3.), we determined the significant ones. Tested with the aforementioned significance test, the results were more self-explanatory (Fig. 6). With HU soil parameters (Run A-B and Run H-U) at lower thresholds, 8-9 out of 10 days were significantly (p=0.05) different. Somewhatless cases (4 to 6 days) were obtainedwith soil texture change (Run A-H). Fig. 3: Distribution of a) interpolated, measured 24h P, b) - f) differences between simulated 24h P fields. On this selected day a heavy precipitating system trailed from south west to north east, causing generally over 10 mm/24h but up to 40 mm/24h precipitation (Fig. 3a). As it can be seen mainly the parameter table change causes the greatest differences (Fig. 3b) followed by the initial SMC (Fig. 3e), and the soil texture (Fig. 3c). These differences usually appear as a shift in the precipitating system, however in the case of Θwsensitivity (Fig. 3f) it is more sporadic. The prevailing effect of the HU parameters is obvious in term of TSS (Fig. 4), it doesn’t matter if the texture distribution is FAO (Run A-B) or RISSAC (Run H-U) the HU parameters offer a better forecast. p = 0.3 The initial and boundary conditions for the MM5 were obtained from the ECMWF MARS database. For the major sensitivity test 10 for others 2 case studies were analysed. The analysis include verifications, which are always referring to 24h P. Measurements required for verification incorporates rain-gauges were interpolated with kriging to the model grid, where the kriging error in all cases were below 1%. The skill of the forecasts were determined with True Skill Statistics (TSS) (Ebert&McBride, 1997; Nurmi, 2003). Fig. 4: True skill statistics differences derived from 24h P fields. Thresholds indicate the minimal amount of precipitation taken into account in a grid cell. PBL andcloud formation 13.07.2009, 10 UTC – Run A -B Aside the analysis on convective precipitation further tests had been recently taken on the sensitivity of the PBL height. The surface energy balance depends on incoming radiation and the properties of the surface, hence the SMC is an important factor. Parameter table changes caused soil texture dependent alterations in the sensible heat flux (SHFLUX) (Fig. 7.). The HU parameters define a soil with higher available SMC, causing it to be dryer on the contrary to the US soils with the same initial conditions. Less SMC results more SHFLUX. This caused notably higher (over 400m) PBL top (Fig. 8.). Naturally the allocation of energy and moisture ensures change in cloud formation. Dryer soil caused not only higher PBL but also generally less low- and midlevel cloud coverage as well. Detailed texture to texture analyses on the effect of soil on PBL and cloud formation is planned in the near future. 13.07.2009, 10 UTC – Run A -B Fig. 8: Simulated PBL height and cloudiness difference for parameter table change(contour lines indicate every 10% change from ±5%). Fig. 7: Simulated sensible heat flux difference for parameter table change. Conclusion References Chen, F. and J. Dudhia, 2001: Coupling and Advanced Land Surface-Hydrology Model with the Penn State-NCAR MM5 Modeling System. Part I. Model Implementation and Sensitivity. Mon. Wea. Rev. 129, 569-585. Ebert, E.E. and McBride, J.L., 1997: Methods for verifying quantitative precipitation forecast: application to the BMRC LAPS model 24-hour precipitation forecast. BMRC Techniques development report No. 2., Melbourne, Australia, 87 pp Fodor, N. and Rajkai, K., 2005: Estimation of Physical Soil Properties and Their Use in Models (in Hungarian). Agrokémia és Talajtan, Vo. 54, 25--40. Grell, G., J. Dudhia and D. Stauffer, 1994: A description of the fifth generation Penn State/NCAR Mesoscale Model. NCAR Tech. Note NCAR/TN-398+STR, 117 pp. Janjic, Z. I., 1990: The step-mountain coordinate–physical package. Mon. Wea. Rev. 118, 1429-1443. Janjic, Z.J., 1994, The step-mountain Eta coordinate model. Further developments of the convection, viscous sublayer and turbulent closure schemes. Mon. Wea. Rev. 112, 927-945. Mlawer, E. J., S. J. Taubman, P. D. Brown, M. J. Iacono, and S. A. Clough, 1997: Radiative transfer for inhomogeneous atmosphere: RRTM, a validated correlated-k model for the longwave. J.Geophys. Res., 102 (D14), 16663-16682. Nurmi, P., 2003: Recommendations on the verification of local weather forecasts. ECMWF Tech. Memo. 430, 18pp. Reisner, J., R.M. Rasmussen and R.T. Bruintjes, 1998: Explicit forecasting of supercooled liquid water in winter storms using the MM5 mesoscale model. Quart. J.Roy. Meteor. Soc. 124, 1071-1107. Wilcoxon, F. , 1945: Individual comparisons by ranking methods. Biometrics Bulletin, 1, 80–83. Results indicate that soil hydraulic properties have significant effect on precipitation intensity and distribution in heavy precipitation events on both meso-β and γ scale without disturbing large scale pattern of the atmospheric circulation. The 24 hours accumulated precipitation differences can be up to 30 mm locally. Ranking the tests by their relative effect on true skill statistics (Fig. 9.) – note only from 2 days - it can be said that the major changes were caused by the parameter table change and the replacement of both soil texture and parameters. The distribution of parameters in a grid cell namely if it is homogeneous or have Gaussian distribution and the initial SMC were also important features in average. However if only the first threshold (every cell with more than or equal to 1mm/24h precipitation) is the viewpoint then the soil parameters are as important as the initial SMC. Interestingly the replacement of soil texture distribution in Hungary has the least sensitivity, probably because it affected only about 40% of the model domain. Where precipitation did not occur, the convective cloud formation was affected mainly through the changes in the PBL. Namely, PBL height and cloud formation were sensitive to the changes of soil hydraulic characteristics via latent and sensible heat flux changes. Fig. 9.: Ranking of the result of the sensitivity test derived from 2 case studies. Acknowledgements- The study is financially supported by the National Program for Research and Development (project number NKFP3-00022/2005) and AÖU PhD Semester Scholarship ACM-2007-01265. The maps were created with Generic Mapping Tools, NCAR Graphics and Integrated Data Viewer.


