Download
1 / 3
30 likes | 151 Views
TABLE S1. Proteins induced by 300mM citric acid, pH 3.5, were identified by peptide mass fingerprinting. Spot. No. No. of matching peptides (%) a. Matched peptide coverage (%) b. Exp. Pred. Exp. Pred. Top ranking protein in MS-Fit search d. SwissProt Accession No.

E N D
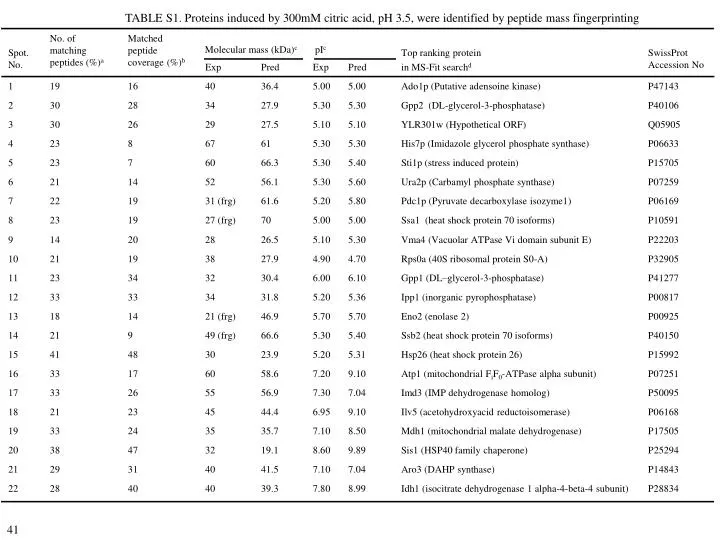
TABLE S1. Proteins induced by 300mM citric acid, pH 3.5, were identified by peptide mass fingerprinting Spot. No. No. of matching peptides (%)a Matched peptide coverage (%)b Exp Pred Exp Pred Top ranking protein in MS-Fit searchd SwissProt Accession No Molecular mass (kDa)c pIc 1 19 16 40 36.4 5.00 5.00 Ado1p (Putative adensoine kinase) P47143 2 30 28 34 27.9 5.30 5.30 Gpp2 (DL-glycerol-3-phosphatase) P40106 3 30 26 29 27.5 5.10 5.10 YLR301w (Hypothetical ORF) Q05905 4 23 8 67 61 5.30 5.30 His7p (Imidazole glycerol phosphate synthase) P06633 5 23 7 60 66.3 5.30 5.40 Sti1p (stress induced protein) P15705 6 21 14 52 56.1 5.30 5.60 Ura2p (Carbamyl phosphate synthase) P07259 7 22 19 31 (frg) 61.6 5.20 5.80 Pdc1p (Pyruvate decarboxylase isozyme1) P06169 8 23 19 27 (frg) 70 5.00 5.00 Ssa1 (heat shock protein 70 isoforms) P10591 9 14 20 28 26.5 5.10 5.30 Vma4 (Vacuolar ATPase Vi domain subunit E) P22203 10 21 19 38 27.9 4.90 4.70 Rps0a (40S ribosomal protein S0-A) P32905 11 23 34 32 30.4 6.00 6.10 Gpp1 (DL–glycerol-3-phosphatase) P41277 12 33 33 34 31.8 5.20 5.36 Ipp1 (inorganic pyrophosphatase) P00817 13 18 14 21 (frg) 46.9 5.70 5.70 Eno2 (enolase 2) P00925 14 21 9 49 (frg) 66.6 5.30 5.40 Ssb2 (heat shock protein 70 isoforms) P40150 15 41 48 30 23.9 5.20 5.31 Hsp26 (heat shock protein 26) P15992 16 33 17 60 58.6 7.20 9.10 Atp1 (mitochondrial FiF0-ATPase alpha subunit) P07251 17 33 26 55 56.9 7.30 7.04 Imd3 (IMP dehydrogenase homolog) P50095 18 21 23 45 44.4 6.95 9.10 Ilv5 (acetohydroxyacid reductoisomerase) P06168 19 33 24 35 35.7 7.10 8.50 Mdh1 (mitochondrial malate dehydrogenase) P17505 20 38 47 32 19.1 8.60 9.89 Sis1 (HSP40 family chaperone) P25294 21 29 31 40 41.5 7.10 7.04 Aro3 (DAHP synthase) P14843 22 28 40 40 39.3 7.80 8.99 Idh1 (isocitrate dehydrogenase 1 alpha-4-beta-4 subunit) P28834 41
Table S1. (cont…) aThe number of tryptic peptides assigned to the protein divided by the total number of tryptic pepides predicted for the protein expressed as a percentage bThe number of amino acids in the matched peptides divided by the total number of amino acids in the predicted protein sequence expressed as a percentage cTheoretical PI and molecular weights were obtained from the protein entry in the MIPS database (http://mips.gsf.de/cgi-bin/proj/yeast) dThe programme MS-Fit (URL: http://prospector.uscf.edu/ucsfhtml3.2/msfit.htm) was used to search the SwissProt database for proteins with calculated tryptic peptide masses that matched the measured experimentally-derived masses eThe term ‘frg’ in brackets indictaes that the protein detected was a proteolytic cleavage fragment 42
TABLE S4. Proteins whose expression is affected by HOG1 identified by peptide mass fingerprinting Spot. No. No. of matching peptides (%)a Matched peptide coverage (%)b Exp Pred Exp Pred Top ranking protein in MS-Fit searchd SwissProt Accession No Molecular mass (kDa)c PIc 23 16 19 31 30.1 4.90 4.80 Bmh1(Brain modulosignalin homolog) P29311 24 22 34 35 40.3 5.00 5.23 Pdb1 (beta subunit of pyruvate dehydrogenase) P32473 25 17 26 35 34.8 5.90 5.80 Ura1 (dihydroorotate dehydrogenase) P28272 26 21 14 29 (frg)e 39.6 6.00 5.51 Fba1 (aldolase) P14540 27 24 56 26 25.7 6.00 5.26 Ydr533cp (hypothetical protein) Q04322 28 33 27 25 (frg)c 53.9 4.8 6.19 Gnd1p (6-phosphogluconate dehydrogenase) P38720 29 26 27 41 36 5.50 5.38 Car1 (arginase) P00812 A 42 31 32 28 4.90 4.69 Rps0b (40S ribosomal protein S0-B) Q46654 B 12 27 29 18.7 4.80 4.80 Egd2 (GAL4 DNA-binding enhancer protein 2) P38879 aThe number of tryptic peptides assigned to the protein divided by the total number of tryptic pepides predicted for the protein expressed as a percentage bThe number of amino acids in the matched peptides divided by the total number of amino acids in the predicted protein sequence expressed as a percentage cTheoretical PI and molecular weights were obtained from the protein entry in the MIPS database (http://mips.gsf.de/cgi-bin/proj/yeast) dThe programme MS-Fit (URL: http://prospector.uscf.edu/ucsfhtml3.2/msfit.htm) was used to search the SwissProt database for proteins with calculated tryptic peptide masses that matched the measured experimentally-derived masses eThe term ‘frg’ in brackets indictaes that the protein detected was a proteolytic cleavage fragment 48
