Download
1 / 32
350 likes | 540 Views
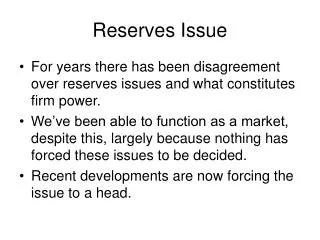
International Reserves and Pooling. Hernán Lacunza. Central Bank of Argentina. Plan. Reserves accumulation: theoretical and empirical models Optimal reserves level: adequacy indicators and econometric analysis Argentina: accumulation and sterilization

E N D
International Reserves and Pooling Hernán Lacunza Central Bank of Argentina
Plan • Reserves accumulation: theoretical and empirical models • Optimal reserves level: adequacy indicators and econometric analysis • Argentina: accumulation and sterilization • Pooling reserves: Asia vs. Latin America experiences
12.7% Million of U$S 5.0% 1.75% International Reserves of Central Banks International Reserves (world total), 1948-2004
Reserves accumulation: country groups International Reserves (world total), constant dollars, 1973-2004
1945 1960 1975 1990 2005 Global Dynamics : Stylized Facts
Insurance against sudden stops Financial crises prevention Reduction of Sovereign Risk Demand for Reserves Theory Level of trade (+) Volatility of trade (+) Opportunity Cost (-) Marginal Propensity to Import (-) - Traditional Approach - Modern Approach - Competitiveness/Real Exchange Rate
a) Heller (1966) b) Hamada and Ueda (1977) C) Frenkel and Jovanovic (1981) d) Kelly (1970) where e) Clark (1970) Traditional Approach: Some Models (1)
Modern approach (2): Self-insurance against Sudden Stops • Aizenman and Marion (2004): Reserves are precautionary saving when countries are restricted to international liquidity. • Aizenman and Lee (2005): Banks intermediate between external funds and long term domestic investment projects. Investment are decided before a sudden stop occurs. Because there is not a credible international lender of last resort, build-up reserves is a self-insurance policy which avoid the cost of a premature liquidation of assets.
STOCK MARKETS AND INTERNATIONAL RESERVES 50% COL TUR 40% BRA HUN RUS 30% POL IND MEX CHR (% stock market FALL in USD during May/June turmoil) SAF MOR INDS PHI ARG CHN EGY 20% PER KOR THA CHI 10% MAL VEN 0% 0% 10% 20% 30% 40% 50% 60% (International reserves as % of GDP in 2005) Source: Morgan Stanley and IMF. Modern approach (3): Reserves and Financial Crisis • Distayat (2001): Risk adverse countries pay a higher opportunity cost for reserve to reduce crisis probability. • Li and Rajan model (2005): Reserves could compensate for a weak fundamentals. • Feldstein (1999): Reserves make an attack on the currency less likely or improves the ability to act a more orderly adjustment.
Reserves/GDP EMBI+ Modern approach (4): Reserves and Country Risk • Ben-Bassat and Gottlieb (1992): positive relationship between cost of default and demand of reserves. Countries which had experienced defaults should demand more reserves. • Soto et al. (2004): Higher reserve levels imply higher ratings and lower risk. • Turner and Moreno (2004): “Battle for reserves”, a country is more credible than a similar one when have higher reserves.
Competitiveness and Exchange Rate Regime Systematicaccumulators
Reserves and Exchange Rate Regime Systematicaccumulators
50% 50% 2 2 R 40% 40% 30% 30% China 1997 China 1997 Change in Monetary Base Change in Monetary Base A A lgeria lgeria 2004 2004 China 2004 China 2004 20% 20% Ukraine Ukraine 2005 2005 10% 10% Singapore Singapore 1995 1995 Mala Mala y y s s ia ia 1993 1993 China 1995 China 1995 0% 0% 0% 0% 10% 10% 20% 20% 30% 30% 40% 40% 50% 50% Change in International Reserves Change in International Reserves Systematic Accumulation and Sterilization
M = 1 R adequate 3 = 2 R DECP adequate = 3 R 0 . 125 * M 2 * RP adequate M = + + 4 R DECP 0 . 125 * M 2 * RP adequate 3 Optimal Reserves Level: Adequacy Indicators • De Beaufort Wijnholds et al. (2001) a) Commercial Criterion b) Financial Criteria c) Commercial and Financial Criterion
Observed Level of Reserves ( logarithmic scale) Adequate Level of reserves (logaritmic scale) Selected LATAM contries Other Emerging countries Adequacy Indicators (2004): Financial and Commercial Criterion
International Reserves (Billion of U$S) Short-Run External Debt (Billion of U$S) Reserves and Short-Run External Debt (2005)
Dependent Variable: Log. Reserves to GDP Standard Explanatory variables Coefficient P value error Inertia (Rese rves - GDP in t - 1) *** 0.000 0.8529464 0.0256205 GDP PPP per inhabitant * 0.074 0.0016251 0.0009036 GDP PPP per inhabitant ^ 2 ** 0.032 - 5.98e - 06 2.76e - 06 Imports / GDP * 0.094 0.0829643 0.0491948 Capital inflows / GDP * 0.053 .0428755 .0219807 Volati lity of Exports - 0.0226167 0.018692 0.228 Volatility of Capital Inflows - 0.0123594 0.0227256 0.587 Opportunity cost - 0.0422273 0.512 0.0641736 Regional imitation *** 0.000 0.0041718 0.0008114 Pure float 0.0001283 0.0299053 0.997 Managed float 0. 0243429 0.0312476 0.437 Crawling Peg - 0.0054370 Optimal Reserve Level: Econometric Analysis 0.0281226 0.847 Indeterminate exchange rate regime 0.0750048 0.1309026 0.568 Shift Dummy Variable1990 0.0711959 ** 0.0285057 0.014 - 0.0142478 0.0275846 0.606 Shift Dummy Variable1998 Constant *** 0.003 - 0.490292 5 0.1621275 Number of countries 139 Number of observations 2638
Reserves Hoarding as Prudent Monetary Policy International Reserves of Argentina 28.0 billion 26.3 billion 30.00 25.00 20.00 Billion of US$ 15.00 10.00 5.00 9.4 billion 0 2006 1977 1978 1979 1980 1982 1983 1984 1985 1987 1988 1989 1990 1992 1993 1994 1995 1997 1998 1999 2000 2002 2003 2004 2005
Prudent Monetary Policy: deep sterilization of reserves purchases 2005 average: 78% 2006 average: 70% Source: BCRA.
Argentina: Reserves and External Debt External Debt / Reserves 2004 2005 2006 Argentina 10,69 4,03 3,94 Brazil 4,18 3,23 3,06 Chile 2,74 2,58 2,57 Mexico 2,50 2,14 1,89 Korea 0,85 0,76 0,71 China 0,38 0,30 0,25 Thailand 1,05 0,92 0,85
2,30 2,30 2,30 2,30 2,20 2,20 2,20 2,20 2,10 2,10 2,10 2,10 2,00 2,00 2,00 2,00 EMBI+ Argentina/EMBI+ Emerging Markets 1,90 1,90 1,90 1,90 1,80 1,80 1,80 1,80 1,70 1,70 1,70 1,70 1,60 1,60 1,60 1,60 1,50 1,50 1,50 1,50 15/12/2005 15/12/2005 15/12/2005 15/12/2005 15/01/2006 15/01/2006 15/01/2006 15/01/2006 15/02/2006 15/02/2006 15/02/2006 15/02/2006 15/03/2006 15/03/2006 15/03/2006 15/03/2006 15/04/2006 15/04/2006 15/04/2006 15/04/2006 15/05/2006 15/05/2006 15/05/2006 15/05/2006 15/06/2006 15/06/2006 15/06/2006 15/06/2006 15/07/2006 15/07/2006 15/07/2006 15/07/2006 15/08/2006 15/08/2006 15/08/2006 15/08/2006 15/09/2006 15/09/2006 15/09/2006 15/09/2006 Results: less vulnerability to foreign shocks Argentinian Risk vs Emerging Markets Risk
Risks and Hedge Type of shock Hedge Global (non diversifiable) Reserve Accumulation Regional (partially diversifiable) Multilateral Institutions Idiosyncratic (diversifiable) Regional Reserve Founds (pooling)
Reserve Pooling Advantages Weaknesses • Direct • Reducing reserve costs • Avoiding CB lender of last resort limitations • Enhance macro and financial stability • Indirect • Contributing to regional capital market development • De-dollarization (systemic currency missmatch) • Reducing external funding costs • Symmetric shocks hitting region countries (Mundell’s OCA) • Moral hazard due to asymmetric(endogenous vs. exogenous problems) or incomplete (liquidity vs. solvency) information • Difficulties in monitoring, “conditionalities” and enforcement • Political Economy: loan = lender
Regional Pools: Asian Experience (ASEAN + 3*) 2000: Agreement to inject liquidity in economies with Balance of Payment problems (as in 97-98 crisis) Long Run Lending 2003: Asian Bond Fund 06/2003:ABF1 (U$S) Promoting domestic currency bond markets 06/2005:ABF2 (local currency) U$S 2 billon * Honk Kong, Indonesia, Malaysia, Philippines, Singapore, Thailand, China, Australia, Japan, New Zeland
1976: Andean Reserve Fund 1991: Latin American Reserve Fund (FLAR) Regional Pools: Latin America* Objective: helping member countries during episodes of balance of payment difficulties via direct lending or offering collateral to potential lenders Aims: balance of payments, debt restructuring, liquidity and contingencies Assembly: Ministers of Finance Board of Directors: Central Bank Governors and Executive President Capital: U$S 2.100 million Risk Rating: Aa2 Moody’s (stable), A+ S&P * Bolivia, Colombia, Chile, Ecuador, Peru, Venezuela
Concluding Remarks • Why do so many countries follow an aggressive strategy of reserve accumulation? • Asymmetric financial and trade integration: high volatility for emerging countries • Global imbalances: non negligible probability of sudden changes in the international economy • The lack of a reliable global financial architecture with a lender of last resort (after financial crisis of the 90´s) • Competitive imitation among emerging countries, specially during intermediate development stages (U shape relationship) • Because of the financial markets imperfections, liquidity is a reasonable way of self-insurance
Concluding Remarks and Policy Lessons (2) • Although self-insurance could be considered a second best solution, reserves pools are not yet developed in the region. Problems of political economy • Multilateral institutions seem unable to manage a pool. • Although there are not optimal level indicators, some “proxies” and econometric models show that there is still room for the continuity of this policy (checking the monetary effects)