Download
1 / 28
280 likes | 804 Views
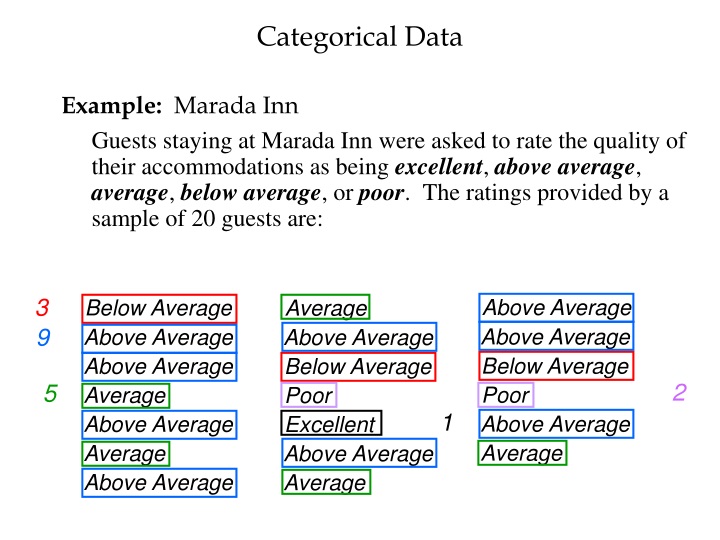
Categorical Data. Guests staying at Marada Inn were asked to rate the quality of their accommodations as being excellent , above average , average , below average , or poor . The ratings provided by a sample of 20 guests are:. Example: Marada Inn. Above Average Above Average

E N D
Categorical Data Guests staying at Marada Inn were asked to rate the quality of their accommodations as being excellent, above average, average, below average, or poor. The ratings provided by a sample of 20 guests are: Example: Marada Inn Above Average Above Average Below Average Poor Above Average Average Average Above Average Below Average Poor Excellent Above Average Average Below Average Above Average Above Average Average Above Average Average Above Average 3 9 2 5 1
Categorical Data Example: Marada Inn Poor Below Average Average Above Average Excellent Rating Frequency 2 3 5 9 1 Total 20
Categorical Data Example: Marada Inn Relative Frequency Percent Frequency Poor Below Average Average Above Average Excellent Rating Frequency 10 15 25 45 5 100 2 .10 3 .15 5 .25 9 .45 1 .05 Total 20 1.00
10 9 8 7 6 5 4 3 2 1 Categorical Data Marada Inn Quality Ratings Frequency Rating Excellent Poor Average Above Average Below Average
Categorical Data Marada InnQuality Ratings Excellent 5% Poor 10% Below Average 15% Above Average 45% Average 25%
Pelican Stores Pelican Stores is chain of women’s apparel stores. It recently ran a promotion in which discount coupons were set to customers of other National Clothing stores. Data collected for a sample of 100 in-store credit card transactions at Pelican Stores during one day while the promotion was running are shown in Table 2.18. Customers who made a purchase using a discount coupon are referred to as promotional customers and customers who made a purchase but did not use a discount coupon are referred to as regular customers. Because the promotional coupons were not set to regular Pelican Stores customers, management considers the sales made to people presenting the promotional coupons as sales it would not otherwise make. Customer 5 purchased 2 items, … which cost her $54
Pelican Stores Pelican Stores is chain of women’s apparel stores. It recently ran a promotion in which discount coupons were set to customers of other National Clothing stores. Data collected for a sample of 100 in-store credit card transactions at Pelican Stores during one day while the promotion was running are shown in Table 2.18. Customers who made a purchase using a discount coupon are referred to as promotional customers and customers who made a purchase but did not use a discount coupon are referred to as regular customers. Because the promotional coupons were not set to regular Pelican Stores customers, management considers the sales made to people presenting the promotional coupons as sales it would not otherwise make. Pelican’s management would like to use this sample data to learn about its customer base and to evaluate the promotion involving discounts. Managerial Report Using graphs and tables, summarize the qualitative variables.
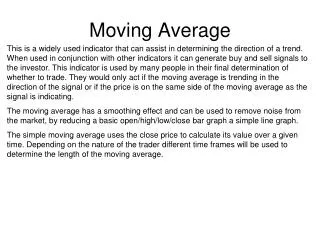
Quantitative Data Example: Hudson Auto Repair The manager of Hudson Auto would like to have better understanding of the cost of parts used in the engine tune-ups performed in the shop. She examines 50 customer invoices for tune-ups. The costs of parts, rounded to the nearest dollar.
Quantitative Data sorted Example: Hudson Auto Repair minimum maximum
Quantitative Data Cost ($) Frequency 50-59 60-69 70-79 80-89 90-99 100-109 2 13 16 7 7 5
Quantitative Data Percent Freq Relative Freq Cost ($) Frequency 50-59 60-69 70-79 80-89 90-99 100-109 2/50 .04 4 2 13/50 26 .26 13 16/50 32 .32 16 7/50 .14 14 7 7/50 .14 14 7 5/50 .10 10 5 100 1.00 50
18 16 14 12 10 8 6 4 2 Quantitative Data Tune-up Parts Cost Frequency Parts Cost ($) 50 60 70 80 90 100 110
Quantitative Data Symmetric Moderately Skewed Left Highly Skewed Right
Quantitative Data Ogive for Hudson Auto Repair Parts Cost ($) Cumulative Frequency Parts Frequency < 60 < 70 < 80 < 90 < 100 < 110 Cost ($) 50-59 60-69 70-79 80-89 90-99 100-109 2 13 16 7 7 5 2 15 31 38 45 50 50
Quantitative Data Ogive for Hudson Auto Repair Cumulative Relative Frequency Cumulative Percent Frequency Cumulative Frequency < 60 < 70 < 80 < 90 < 100 < 110 Cost ($) 4 30 62 76 90 100 .04 2 .30 15 .62 31 .76 38 .90 45 1.00 50
100 80 60 40 20 Quantitative Data Example: Hudson Auto Repair ($110, 100%) Tune-up Parts Cost ($100, 90%) ($90, 76%) Cumulative Percent Frequency ($50, 0%) ($80, 62%) ($70, 30%) Parts Cost ($) 50 60 70 80 90 100 110 ($60, 4%)
Pelican Stores -- continued Pelican Stores is chain of women’s apparel stores. It recently ran a promotion in which discount coupons were set to customers of other National Clothing stores. Data collected for a sample of 100 in-store credit card transactions at Pelican Stores during one day while the promotion was running are shown in Table 2.18. Customers who made a purchase using a discount coupon are referred to as promotional customers and customers who made a purchase but did not use a discount coupon are referred to as regular customers. Because the promotional coupons were not set to regular Pelican Stores customers, management considers the sales made to people presenting the promotional coupons as sales it would not otherwise make. Pelican’s management would like to use this sample data to learn about its customer base and to evaluate the promotion involving discounts. Managerial Report Using graphs and tables, summarize the qualitative variables. Using graphs and tables, summarize the quantitative variables.
Summarizing Two variables Home Style Price Range Colonial Log Split A-Frame Total 18 6 19 12 55 < $99,000 > $99,000 45 12 14 16 3 30 20 35 15 Total 100 Example: Finger Lakes Homes.xls qualitative variable Quantitative variable
Summarizing Two variables Home Style Price Range Colonial Log Split A-Frame Total 18 6 19 12 55 < $99,000 > $99,000 45 12 14 16 3 30 20 35 15 Total 100 Example: Finger Lakes Homes.xls
Summarizing Two variables Home Style Price Range Colonial Log Split A-Frame Total 18 6 19 12 55 < $99,000 > $99,000 45 12 14 16 3 30 20 35 15 Total 100 Home Style Price Range Colonial Log Split A-Frame Total 0.3273 0.1091 0.3455 0.2182 < $99,000 > $99,000 1.0000 0.2667 0.3111 0.3556 0.0667 1.0000
Summarizing Two variables Home Style Price Range Colonial Log Split A-Frame 18 6 19 12 < $99,000 > $99,000 12 14 16 3 30 20 35 15 Total Home Style Price Range Colonial Log Split A-Frame 0.6000 0.30 0.5429 0.8000 < $99,000 > $99,000 0.4000 0.70 0.4571 0.2000 Total 1.0000 1.0000 1.0000 1.0000
Summarizing Two variables The crosstabulation for the aggregated UC-Berkley data is Male acceptance rate is higher when data is aggregated. Dividing all of the frequencies above by the number of observations yields what the joint probability table below
Summarizing Two variables Compute the row percentages to show the Simpson’s Paradox
Summarizing Two variables A Negative Relationship y QBigMacs 21 2 x PBigMacs 5.00 0.50
Summarizing Two variables No Apparent Relationship y QNoseHairTrimmers x PBigMacs
Summarizing Two variables Example: Panthers Football Team The Panthers football team is interested in investigating the relationship, if any, between interceptions made and points scored. x = Number of Interceptions y = Number of Points Scored 14 24 18 17 30 1 3 2 1 3
35 30 25 20 15 10 5 0 1 0 2 3 4 Summarizing Two variables y Number of Points Scored x Number of Interceptions
Pelican Stores -- continued Pelican Stores is chain of women’s apparel stores. It recently ran a promotion in which discount coupons were set to customers of other National Clothing stores. Data collected for a sample of 100 in-store credit card transactions at Pelican Stores during one day while the promotion was running are shown in Table 2.18. Customers who made a purchase using a discount coupon are referred to as promotional customers and customers who made a purchase but did not use a discount coupon are referred to as regular customers. Because the promotional coupons were not set to regular Pelican Stores customers, management considers the sales made to people presenting the promotional coupons as sales it would not otherwise make. Pelican’s management would like to use this sample data to learn about its customer base and to evaluate the promotion involving discounts. Managerial Report Using graphs and tables, summarize the qualitative variables. Using graphs and tables, summarize the quantitative variables. Using pivot tables and scatter plots, summarize the variables.