Download
1 / 45
450 likes | 618 Views
The Revival of Observational Research. Dr Hugh Phillips PFB Inc. 866 513 9908 hugh@instore-research.com. In the beginning…. Genesis of Market Research, three approaches: Qualitative. Quantitative. Observational. Observational popular as “completely objective”. But fell out of favour.

E N D
The Revival of Observational Research Dr Hugh Phillips PFB Inc. 866 513 9908 hugh@instore-research.com
In the beginning… • Genesis of Market Research, three approaches: • Qualitative. • Quantitative. • Observational. • Observational popular as “completely objective”. • But fell out of favour. • Until end of last centenary renaissance in UK & Europe.
Why the renaissance? • Oversimplified version… • Consumers changed their decision making until in-store – 73% decisions now made in-store • Major shifts in marketing from conventional media to in-store communications. • In-store communications fastest growing media, overtaking the internet. • Therefore we need research into shopping behaviour.
The research challenge. • Ah but… • Modern stores are too big and complex to shop consciously. • Therefore the great majority of shopping behaviour is unconscious or subconscious. • Let’s prove it with you.
Look at these please Iju rty uio asd fgh jkl zxc vbn mnb vcx zlk jhg fds apo iuy tre wqw qaz wsx edc rfv tgb yhn ujm ujk
Maximum of conscious attention span is seven ‘chunks’. • A ‘chunk’ is a word, phrase or random three letter set. • In practise, maximum is usually 3. • So, how do we cope with the 4,500 pieces of marketing communications in an average store?
The Answer • In the next display, when you find the red square please raise your hand
How long? • There were 30 shapes/colours in that slide. • If you spent just 1/4 second checking each out, would require 7.5 seconds! • If you completed it in less than this you are using an heuristic - a short cut.
Schemata • In fact you used, a subconscious stored routine, called a schemata in psychology . • It is these schemata we use to cope with the complexity of modern stores. • To scan, browse, select products and, in general, shop ~ • SUBCONSCIOUSLY / UNCONSCIOUSLY.
You have just contradicted yourselves • You process visually complex communications subconsciously. • But when you research shoppers – in visually complex stores. • You assume they act consciously!
Back to classic research theory. • Criteria for research questioning. • Does the respondent have the information? • Can they give it? • Will they give it? • By definition respondents are unaware of subconscious or unconscious behaviour. • Therefore most shopping behaviour falls outside this criteria.
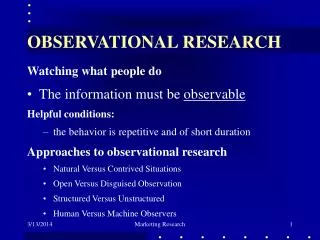
So if you cannot use survey or qualitative – what can you use? • Observation captures behaviour whether it is conscious, subconscious or unconscious.
CASE STUDY Cameras vs. Interviews • Hardware store – decorating accessories aisle. • Cameras: observed behaviour in the aisle. • Interviews: survey of shoppers as they exited the aisle.
Nearly half of the respondents were unaware of their behaviour seconds after it occurred! • It’s not that they had forgotten. • Just unaware of subconscious behaviour.
It gets worse… • Often the research issue is what didn’t the shoppers see / do? • Imagine a question: “What displays didn’t you see in store and why?”
Technology • Traditionally • Video cameras record behaviour in store. • Output, DVD, analysed manually & entered into software • New • Modern software captures images and tracks behaviour automatically.
The law • In Canada, we can observe shoppers on camera for research purposes. • Unlike USA.
Example 1 • Testing in-store communications. • Product, stand, sign, packaging etc.
Two ‘perfect’ executions Design route B is just not communicating. It cannot convert attention gained by stand to attention to product!
Example 2 • Evaluating how customers shop a gondola
And now a perfect display! • In fact, a really dysfunctional display. • The centre shelves are being ignored. • Plus major variations in impact levels – from 7% to 100%! • Loss in sales around 30%, loss of profitability even higher!
Example 3 • Quantifying how customers shop a store
A new concept store Overcrowded areas: Invisible areas: Estimated loss of sales 27% - all easy to fix
Image capture • Micro camera into a display – gondola etc. • Attached to a computer. • Modern software can isolate an image as a human face. • Then identify if it is looking at the display.
Simulation • What it does is sort of like this.
Plus • The software can also identify with reasonable accuracy: • The gender and broad age group.
Advantages • To test a pack, signage, display etc. • In comparison with manual processing: • Lower cost. • Fast turnaround. • Legal in the US.
Tracking shoppers around the store. • It is possible to automatically track shoppers around a store. • But tends not to be of value, as we inevitably want to know what they do! • What they: • Look at. • Interact with. • Buy. • etc.
Clip cameras • Micro cameras attached to spectacles. • Either the respondents’ own or supplied. • The visual data is then loaded into analysis software.
Advantages • Total data capture of all in-store behaviour and visuality. • Incredible level of detail available.
And now… • Launch today of a major new service.
MARI • Part of an international project for in-store metrics. • Six countries now including Canada. • Standard output: • Store traffic, total and by area of store. • Visual impact of all in-store communications. • Interaction levels. • Buying.
Shopper profiles • Each shopper is also profiled by: • Age • Gender • Shopping mission • Categories to be shopped • Frequency of store visits • Basket size • Etc.
Results • Just a selection of the massive database.
Interrogating the database. • Key usage of observational research is to answer those questions you forgot to ask. • As observational research = total behaviour capture. • Can be post hoc analysed ad nauseam. • We got so fed up with running these we now supply an interactive database!
Summary • Why observational research? • Consumers changed to in-store decision making. • So research changed, to understand the consumer. • Because ~ It begins and ends with the consumer.