Download
1 / 50
520 likes | 677 Views
Optimization of Artificial Neural Networks in Remote Sensing Data Analysis. Tiegeng Ren Dept. of Natural Resource Science in URI (401) 874-9035 tren8835@postoffice.uri.edu 10/07/2002. Outline. Introduction of Satellite Remote Sensing Remote Sensing Image Classification Methodology

E N D
Optimization of Artificial Neural Networks in Remote Sensing Data Analysis Tiegeng Ren Dept. of Natural Resource Science in URI (401) 874-9035 tren8835@postoffice.uri.edu 10/07/2002
Outline • Introduction of Satellite Remote Sensing • Remote Sensing Image Classification Methodology • Data and Experiments • Discussion and Conclusion
Earth Surface and Land Cover Map How to achieve an accurate land cover map in natural resources research?
Remote Sensing Remote Sensing is defined as: The science of acquiring, processing and interpreting images that record the interaction between electromagnetic energy and matter.
Different Type of Land Use and Land cover and Spectral Characteristics Blue Band Green Band Red Band Near-infrared Band
From Digital Image to Land-use Map • Multi-spectral Digital Image • Pseudo Color Image • Land-use and Land-cover Map Classification Visualization
Classification System • 6. Brush land • 7. Urban land • 8. Water • 9. Non-forest wetland • 10. Forest wetland In this study, we used the USGS classification with 10 land cover categories: 1. Turf/Grass 2. Barren land 3. Conifer forest 4. Deciduous forest 5. Mixed forest
Remote Sensing Image Classification Statistical Methods Supervised Unsupervised Artificial Neural Network Approaches Rule-based ...
Supervised Remote Sensing Image Classification Soil Vegetation Band 2 (0 ~ 255) Band 1 (0 ~ 255) Water
Classification Process Landsat TM Band1 Band2 Band3 Band4 Band5 Band6 Band7 Observation space Solution space Mapping Relationship 0~255 0~255 0~255 0~255 0~255 0~255 0~255 Category 1 Category .. Category … Category … Category … Category … Category N Water wetland Forest Agri. Urban Residential Methods: Statistical classifier ANN-based classifier 40 45 61 193 80 112 25 (Pattern) Category: Forest
Band 2 (0 ~ 255) Vegetation Soil Water Band 1 (0 ~ 255) Statistical Methods - Need Gaussian (Normal) distribution on the input data which is required by Bayesian classifier. - Restrictions about the format of input data.
Conifer forest Deciduous forest Mixed forest Non-forest Wetland Forest Wetland Brush Land Statistical Methods: How to find a boundary for the following patterns?
Artificial Neural Network Approach No need for normal distribution on input data Flexibility on input data format Improved classification accuracy Robust and reliability
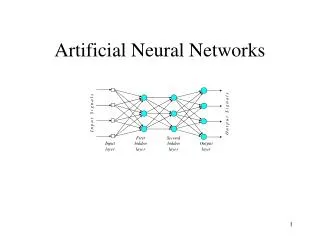
Artificial Neural Network Is Defined by ... … … … … … … … … … • Processing elements • Organized topological structure • Learning rules
Processing Element (PE) Artificial counterparts of neurons in a brain PE Wj1 Wj2 Wj3 Output Input f(x) Wj4 Wj5
… … … … … … … … … PE’s Inputs unitj wj1 o1 wj2 f o2 oj o3 wj3 Function of Processing Elements • Receive outputs from each PEs locate in previous layer. • Compute the output with a Sigmoid activation function F(Sumof(Oi*Wji)) • Transfer the output to all the PEs in next layer PE’s Output
Artificial Neural Network Architecture - Backpropagation ANN (BPANN) Input layer Hidden layer Output layer … … … … … … … … … Input vector i(x1, x2, … xn) Output vector i(o1, o2, … om) Feed Information Analysis Result
Band 2 (0 ~ 255) Vegetation Soil Water Band 1 (0 ~ 255) Pattern Recognition Vegetation: (10, 89) ------> (1,0,0) (11,70) ------> (1,0,0) … … … (1,0,0) Water: (10, 21) ------> (0,1,0) (15, 32) ------> (0,1,0) … … … (0,1,0) Soil: (50, 40) -------> (0,0,1) (52, 40) -------> (0,0,1) … … … (0,0,1)
ANN Design Input layer Hidden layer Output layer Band 2 (0 ~ 255) Vegetation … … … … … … … … (0 ~ 1) Soil (0 ~ 255) (0 ~ 1) (0 ~ 255) (0 ~ 1) How many PEs we need - Basic rules in designing an ANN. Input layer PEs - by dimension of input vector Output layer PEs - by total number of patterns (classes) Water Feed Forward Band 1 (0 ~ 255) Pattern Back-Propagate
ANN Training - From Pattern to Land Cover Category Vegetation: (10, 89) ------> (1,0,0) (11,70) ------> (1,0,0) … … … (1,0,0) Water: (10, 21) ------> (0,1,0) (15, 32) ------> (0,1,0) … … … (0,1,0) Soil: (50, 40) -------> (0,0,1) (52, 40) -------> (0,0,1) … … … (0,0,1) A vegetation pixel (10, 89) ------> (1,0,0) … … … … … … … … 1 (Vegetation) 10 0 (Water) 89 0 (Soil) Feed Forward Back-Propagate Pattern Land Cover Category
Vegetation Soil water After Training A Well-trained ANN … … … … … … … … 1 (Vegetation) A new pixel (x,y), x in band 1, y in band 2 x 0 (Water) y 0 (Soil)
Problems with Traditional Back-Propagation ANN Approaches Time-consuming Always over 10000 iteration, over 5 hours for a small case. Black box - uncontrollable training Easily trapped in local minimum. Training result unpredictable
Optimization Techniques to ANN Approach Data Representation - Transform to Binary and Gray code format. Improved Convergence Algorithms - Apply Conjugate Gradient and Resilient Propagation. Weight initialization - Linear Regression.
Data Representation Data representation - Use Binary format and gray code format instead of integer value. Avoid to compute in the saturation range of the activation function Increased the computation space (from 6 to 48) Make the value more smoothly - Gray Code
Saturation Range of Activation Function - Sigmoid Function Saturation Original Inputs: 0 ~ 255 New Format: 0 or 1
Coding Method Forest Pixel Integer format Binary format 40 45 61 193 80 112 25 0 0 1 0 1 0 0 0 0 0 1 0 1 1 0 1 0 0 1 1 1 1 0 1 1 1 0 0 0 0 0 1 0 1 0 1 0 0 0 0 0 1 1 1 0 0 0 0 0 0 0 1 1 0 0 1 6 Integers 48 Integers
Gray Code vs. Binary Format • Gray Code is another coding system, similar to binary • Can better represent continuous value Integer Binary format Gray code format 127 0 1 1 1 1 1 1 1 0 1 0 0 1 0 0 0 128 1 0 0 0 0 0 0 0 0 1 0 1 1 0 0 0
Improved Convergence algorithms To Make the convergence more robust and reliable, apply: • Conjugate Gradient (CG) • Resilient Propagation (RPROP)
Error Space and Weight Adaptive Steps Total Error Wkl Wij
Weight Adaptive with Conjugate Gradient Error Global minimum Wij
Weight initialization Cut convergence time, do weight initialization using linear regression to pre-process the internal weight, make ANN adapted to the target pattern before training.
Data and Experiments Study Area Data Distribution Fine tuning the ANN structure Classification Result
Study Area - Rhode Island 1999 Landsat-7 Enhanced Thematic Mapper Plus (ETM+) Image Band 4,3,2 In RGB Band 5,4,3 In RGB
Turf / Grass Barren land Conifer forest Deciduous forest Mixed forest Brush Land Urban area Water Non-Forest Wetland Forest Wetland Distribution of Training Data Patterns Plotted by band 3 x 4 Patterns Plotted by band 4 x 5
ANN Design and Tuning Number of PEs in input layer = Number of spectral Bands in the remote sensing image Number of PEs in output layer = Number of land cover categories Number of PEs in hidden layer(s) to be determined for best performance
Classification Result- A Close Look Rhode Island 1999 Land-use and Land-cover map Rhode Island 1999 ETM+
Discussion and Conclusion • Accuracy • Gray code Vs. Integer format • Robust and reliability • Discuss on number of hidden layer PEs
Accuracy Comparison Non-optimized ANN Accuracy - 79.58% Optimized ANN Accuracy - 92.27%
Gray-code vs. Integer Value Comparison Between Gray Code and Integer Format
Resilient Propagation and Weight Initialization Improvement in robust and reliability
Hidden Layer PE Number’s Influence On Classifier’s Performance. • 48-150-10 ( 48 inputs, 150 hidden neurons, 10 output classes) • 48-250-10 ( 48 inputs, 250 hidden neurons, 10 output classes) • 48-350-10 ( 48 inputs, 350 hidden neurons, 10 output classes)
Hidden Layer PE Number’s Influence On Classifier’s Performance. 350 hidden layer PEs provide the best performance
Conclusion • Coding method, especially the Gray code is important to Remote Sensing image classification. • Optimized ANN provide a robust and reliable classification solution • Optimized ANN lead to higher classification accuracy • Improved natural resources mapping
AcknowledgementThe research was funded by NASA (Grant No. NAG5-8829) to Dr. Y.Q. Wang Dr. Y.Q. Wang (major professor) Dr. Pete August (NRS, committee member) Dr. Ken Yang (EE&CE) Dr. Tom Boving (GEO) Lab for Terrestrial Remote Sensing Environmental Data Center