Download
1 / 41
410 likes | 485 Views
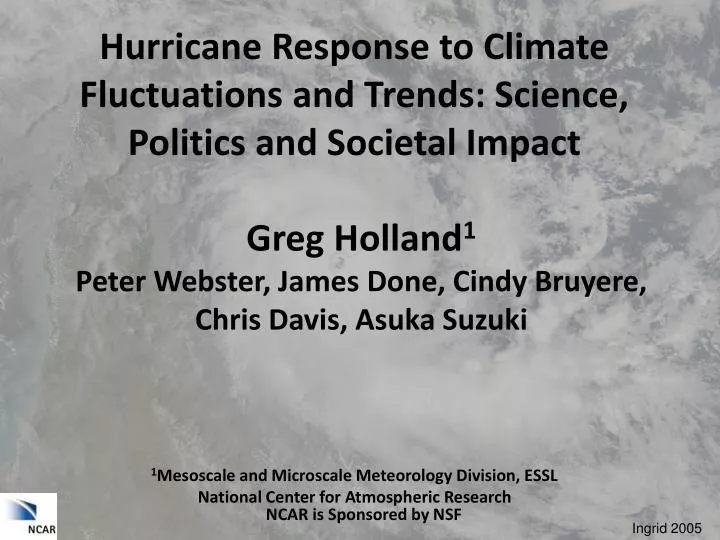
Hurricane Response to Climate Fluctuations and Trends: Science, Politics and Societal Impact. Greg Holland 1 Peter Webster, James Done, Cindy Bruyere, Chris Davis, Asuka Suzuki. 1 Mesoscale and Microscale Meteorology Division, ESSL National Center for Atmospheric Research.

E N D
Hurricane Response to Climate Fluctuations and Trends: Science, Politics and Societal Impact Greg Holland1 Peter Webster, James Done, Cindy Bruyere, Chris Davis, Asuka Suzuki 1Mesoscale and Microscale Meteorology Division, ESSL National Center for Atmospheric Research NCAR is Sponsored by NSF Ingrid 2005
What is a Hurricane and How Does it Work? Holland, CU Lecture 0309
What’s in a Name • Tropical Cyclone • Coiled Snake • Hurricane • Devil God • Typhoon • Greek Monster • Cock-eyed Bob • Aussie Slang • Kamikaze • Divine Wind Holland, CU Lecture 0309
Spiral Bands Low Inflow Warm Clear Eye Dense Overcast Cloud High Outflow Cold Holland, CU Lecture 0309 Hurricane Gonu, Arabian Sea, 2007
Just Another Vortex With special characteristics Holland, CU Lecture 0309
Vertical Cross Section Heat Out Subsidence Warming Heat Engine Heat In High Winds High Winds Low Surface Pressure Fuel Source Holland, CU Lecture 0309
Hurricane Formation We only have a rudimentary understanding of why and how hurricanes form Holland, CU Lecture 0309
Hurricane Formation • Genesis Factors (Current Climate): • SST>26 C • Sufficient background rotation • Low vertical wind shear • Moist, unstable environment. Holland, CU Lecture 0309
Formation of Hurricane Georges Holland, CU Lecture 0309
Intensity • Maximum Potential Intensity can be assessed from Heat Engine Theory: • Proportional to SST and upper-level temperatures • Actual Intensity is Extremely Complex: • Vertical wind shear • Cyclone cools the ocean • Dry air intrusions • Internal instabilities Holland, CU Lecture 0309
Propagation on Earth Gradient Motion Mechanisms Steering • Sensitivity • Horizontal Shear • Vertical Shear • Asymmetries • Environmental • Interactions • Structure and Intensity Changes Holland, CU Lecture 0309
Cyclones that Changed the World • 1274 and 1281 The “Divine Wind (kamikaze)” destroyed 300 ships and prevented the Mongol invasion of Japan; • 1789 The original “cyclone” named by Piddington in his reanalysis in 1839. • 1831 Redfield’s cyclone, a circular vortex. • 1944 Typhoons Able and Cobra smashed up Halsey’s fleet…aircraft reconnaissance, hurricane modification. • 1974 Tracy.. Insurance industry wake up call, building codes. • 1992 Andrew…collapse of the insurance industry • 2005 Hurricane Katrina…poster child for change in public opinion on climate change. What is the common factor for the late 20th and 21st century storms? Holland, CU Lecture 0309
They were all “Man-Made” Disasters Andrew Tracy Katrina Holland, CU Lecture 0309
NATURAL DISASTER = NATURAL HAZARDx VULNERABILITY Colorado is very vulnerable to Hurricanes! How many rigs are there in the gulf of Mexico? Where are our major oil refineries? Holland, CU Lecture 0309
Impacts of Hurricane Katrina • ~150 old rigs lost • 2 new rigs badly damaged • Fuel Production in New Orleans ceased. Holland, CU Lecture 0309
Katrina Cripples 95% of Gulf's Oil Production “From New Orleans to New York, the jigsaw pieces of the USA's energy infrastructure - its rigs, refineries and pipelines - lay in disarray Tuesday.” “Fearing the worst, energy traders at the New York Mercantile Exchange bid up futures prices to records. "This is clearly the most panic I've seen," said Nymex trader Eric Bolling.” “The gulf accounts for about 23% of the USA's domestic natural gas and 30% of its oil, according to the U.S. Department of the Interior's Minerals Management Service. But the storm interrupted 95% of gulf oil production and 88% of the outer continental shelf's natural gas production, the agency said.” (mywire, 2005) Holland, CU Lecture 0309
Local Costs of Katrina Rita Katrina: Gulf New Orleans Estimated Katrina Cost: Direct: $7.9 billion Holland, CU Lecture 0309
Katrina Country-Wide Impact Transport CPI Full CPI (Bureau of Labor Statistics) Actual Damage: Over $80 billion Tornadoes and Flooding as far away as Quebec Displaced people to most states Government recovery costs: $10-15 billion CPI impact: 1.4-2.3% Cost per Household: $140-230 Total CPI Cost: $16-26 billion Reduction in Economic Growth Rate: 0.5-1%, but this was compensated by subsequent overshoot in the economy (Wikipedia plus US Info State Government) And what of the Political Impact? Holland, CU Lecture 0309
Hurricane Response to Climate Fluctuations and Change Some things are more predictable than others Holland, CU Lecture 0309
Global Climate Change is Predictable Holland, CU Lecture 0309
Predicting Small-Severe Weather System Changes is Difficult Holland, CU Lecture 0309
What we can say about Hurricanes and Climate Change Holland, CU Lecture 0309
Recent Peak Body Assessments • The US Climate Change Science Program (CCSP): Synthesis and Assessment Product Report 3.3 (www.climatescience.gov/Library/sap/sap3-3/final-report/) and, • The “Scientific Assessment of the Effects of Global Change on the United States by the National Science and technology Council (www.climatescience.gov/) Both report the same results Holland, CU Lecture 0309
Current Climate TC1 TC2 TC3 9-year running mean “it is likely that the annual numbers of tropical storms, hurricanes, and major hurricanes in the North Atlantic have increased over the past 100 years, a time in which Atlantic sea surface temperatures also increased.” (Holland and Webster 2007) Holland, CU Lecture 0309
Current Climate 1956-2005 Genesis 1906-1955 Genesis + + - + • “The power and frequency of Atlantic hurricanes have increased substantially in recent decades, though North American mainland land-falling hurricanes do not appear to have increased over the past century.” (Holland 2007) Decrease Increase Holland, CU Lecture 0309
Current Climate • “there is evidence for an increase in extreme wave height characteristics over the past couple of decades, associated with more frequent and more intense hurricanes.” 1996-2005 1980-1990 1996-2005 Average 1.8 m in 30 years! 1977-1990 1996-2005 (Komar and Alan 2008) 1976-1990 Holland, CU Lecture 0309 ESSL Holland, Mensa Atlanta 0309
Current Climate • “There is evidence suggesting a human contribution to recent changes in hurricane activity as well as in storms outside the tropics, though a confident assessment will require further study.” (Emanuel 2007) Holland, CU Lecture 0309
Current Climate • The length of the Atlantic season has increased slightly. Holland, CU Lecture 0309
Future Climate Holland, CU Lecture 0309
Projected Rain and Intensity • “It is likely that hurricane rainfall and wind speeds will increase in response to human-caused warming” Maximum Winds Rain 6-18% per degree Hurricane Rainfall Wind 1-8% per degree (Bengtsson et al 2007) (Knutson et al 2008) Holland, CU Lecture 0309
Projections We Do Not Understand • Hurricane Size? • Regional Distribution Changes? • Increase/Decrease in size of current regions? • Increase in activity in one region, decrease in another? • Seasonal Changes? • Localized Changes? • How will Miami be affected? • Will New York experience more or less? Holland, CU Lecture 0309
Intense Hurricane Changes (Meehl et al 2006) (Holland 2008) Holland, CU Lecture 0309
Atlantic Maximum Wind Variation • There has been no observable change in mean intensity, either for all storms or for hurricanes. Holland, CU Lecture 0309
Atlantic Intense Hurricane Fluctuations Recent changes in tropical cyclone and hurricane frequency, which is un-measurable in mean intensity, is amplified substantially in intense hurricanes. Trend for Cat 5 hurricanes is significant at 99% and this is independent of time period. However, early missed storms are contributing before 1950. Anomaly is % difference from mean Holland, CU Lecture 0309
East Atlantic SST-Cat 5 Relationship Note that, with one exception, all positive Cat 5 anomalies were in above normal SST in the eastern Atlantic. Holland, CU Lecture 0309
Impact of Small Changes on an Ideal Distribution N 10-15% Increase For a given increase in intensity, the % increase in intense systems is around 10 times that for the more common, weaker systems Number 100% Increase Intensity Holland, CU Lecture 0309
1,3,5 ms-1 Uniform Wind Increase for Atlantic Tropical Cyclones Cat 5 increase is at ~10 times the rate of other categories. The end result is a net transfer of cyclones into Cat 5. Cat 5 Cat 5 Cat 5 Holland, CU Lecture 0309
Societal Consequences • Society has generally adapted to common weather events; • Major impacts arise from high-intensity, relatively rare events; • Small, or even undetectable, overall changes to general weather statistics could lead to marked severe weather changes and resulting societal disruption. Holland, CU Lecture 0309
Impact α Vulnerability x Hazard • Vulnerability Varies with: • Predictability of the Hazard • Communication of the Threat….. • Vulnerability Increases with: • Low Awareness and Understanding • Denial • Over Confidence…. • Vulnerability Decreases with: • Improved Understanding • Prudent Action Based on Available Evidence. Holland, CU Lecture 0309
Improved Understanding • Prudent Action Based on Available Evidence. Thank You Holland, CU Lecture 0309 www.ucar.edu
Not Due to Database Errors • Intense hurricane changes since 1945 cannot reasonably be attributed to observing system changes, e.g.: • a) Differences between corrected (Holland 2008, Landsea 1993) and original data; • e) Impact of adding 5 and 10 m/s to all intensities. • Bringing 1950s to current requires making ALL Cat 4 and some Cat 3 into Cat 5! Holland, CU Lecture 0309