Download
1 / 25
250 likes | 340 Views
You need notebook and book!!. Bell Ringer. Population. Big Idea : Population studies are an important part of geography. Population. Population – the total number of people in a given area . What is the population of Greeneville? 15,024 (2012 Census)

E N D
You need notebook and book!! Bell Ringer
Population Big Idea: Population studies are an important part of geography.
Population • Population – the total number of people in a given area. • What is the population of Greeneville? • 15,024 (2012 Census) • Where does it rank in size of cities in TN? • 37th • What is the population of TN? • 6,346,105 • Where does it rank in size to the rest of states? • 17
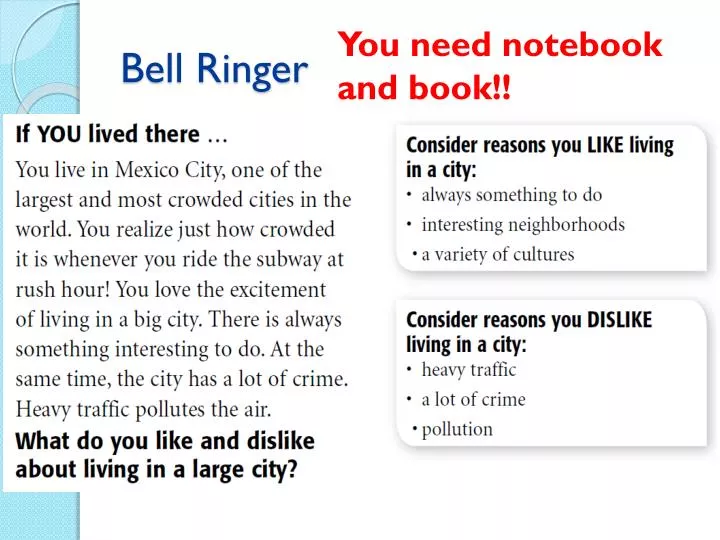
Population Density • Population density is a measure of the number of people living in an area. • How many people per square mile? Mexico City, a classic high-density urban settlement
Population Density Let’s figure the population density, or people per square mile, of Greeneville and Tennessee. • Populations: • Tennessee: 6,346,105, Greeneville: 15,024 • What else do we need? • Size • Tennessee: 42,144 sqmi, Greeneville: 17.01 sq m • 6346105 / 42144 = 151 • 15024 / 17.01 = 883 • Why is there such a big discrepancy?
Which continent is the least densely populated? (has the fewest people per square mile/ kilometer) • Antarctica, which has no permanent residents • Which continent that is the most densely populated overall (has the most people per square mile/kilometer) • Europe
Which countries in South and East Asia are the most densely populated • Possible answers—Japan, the Philippines, Indonesia, China, India • Which continent is the least densely populated? (has the fewest people per square mile/ kilometer) • Antarctica, which has no permanent residents
List three areas on the map that have very low population densities. • possible answers—northern Canada and Greenland, parts of northern Africa, parts of the interiorof China, and parts of the interior of Australia
What might explain why these areas have very low population densities? possible answers—their climates are harsh, with extremetemperatures such as cold in Greenland and northern Canada (near the North Pole) and hot innorthern Africa, interior China, and interior Australia (part of desert regions); these areas alsolikely have fewer resources that people can use to survive.
Five major cities are included on the map. Besides being densely populated, what do some of these cities have in common, based on the map? possible answers—fourare port cities (except for Mexico City); three are located in very densely populated countries(Tokyo, Shanghai, Mumbai); four are located above the equator, in the Northern Hemisphere(except for São Paulo)
What use is population density? • What would happen in places with a high population density? • In high population density areas, land will be more expensive, roads are crowded, buildings are taller. Manhattan Bombay Tokyo
What use is population density? • What would happen in places with a low population density? • Difficult places to live. Rocky Mountains Sahara Desert Antarctica
Clusters of Population • Look back at the map. Where are there places with large areas of dense population? • East and South Asia • Europe • Eastern North America • Why? • Fertile soil • Sources of water • Good climate for growing crops
Got it? • How is population density usually expressed? • As persons per square mile (or km) • How does the population density and the space available differ in Japan and Australia? • Japan has high pop., little space, Australia has low pop., and much open space. • Why do you think land is more expensive in areas with high population density? • Less available land.
Population Change What affects population size? • People are born. • People die. • People move.
Key Statistics of Population Change • Birthrate – the annual number of births per 1000 people. • Death rate – the annual number of deaths per 1000 people. • Natural Increase • the birthrate minus the death rate is the percentage of natural increase. • this is the rate at which a population changes.
Natural Increase • Can this be negative? • Yes • Europe and North America have very low rates of Natural Increase. • In Russia, the birthrate is 9.6% and the death rate is 15.2%.
What if it’s positive? • The country of Mali has a population increase of 3% • In 23 years, the population could double! • What problems might that cause? • Jobs, Education, Medical care
Bell Ringer • What statistic subtracts from a country’s population. • Death rate • Which continents have countries with the lowest rates of natural increase? • Europe and North America • How does migration affect the world population? • It doesn’t. It affects the population of individual countries.
Migration • Migrationis the process of moving from one place to live in another. • Why might people migrate? • Jobs • Lack of good farmland • In the mid-1800’s poverty and disease caused 1.5 million people to leave Ireland. • In the 1800s and early1900s thousands of British migrated to the U.S. for cheap land.
World Population Growth • About 2000 years ago • 1800s • 1999 • 2012 • Why? • Better health care • Improved food 30,000,000 1,000,000,000 6,000,000,000 7,000,000,000
World Population Growth • How much did the world’s population grow between 1950 and 2000? • About 3.6 billion
Classwork / Homework • Vocab Builder • Section Quiz