Download
1 / 45
450 likes | 553 Views
Scalable Algorithms in the Cloud II. Microsoft Summer School Doing Research in the Cloud Moscow State University August 4 2014. Geoffrey Fox gcf@indiana.edu http://www.infomall.org School of Informatics and Computing Digital Science Center Indiana University Bloomington.

E N D
Scalable Algorithms in the Cloud II Microsoft Summer School Doing Research in the Cloud Moscow State University August 4 2014 Geoffrey Fox gcf@indiana.edu http://www.infomall.org School of Informatics and Computing Digital Science Center Indiana University Bloomington
51 Detailed Use Cases: Contributed July-September 2013Covers goals, data features such as 3 V’s, software, hardware 26 Features for each use case Biased to science • http://bigdatawg.nist.gov/usecases.php • https://bigdatacoursespring2014.appspot.com/course (Section 5) • Government Operation(4): National Archives and Records Administration, Census Bureau • Commercial(8): Finance in Cloud, Cloud Backup, Mendeley (Citations), Netflix, Web Search, Digital Materials, Cargo shipping (as in UPS) • Defense(3): Sensors, Image surveillance, Situation Assessment • Healthcare and Life Sciences(10): Medical records, Graph and Probabilistic analysis, Pathology, Bioimaging, Genomics, Epidemiology, People Activity models, Biodiversity • Deep Learning and Social Media(6): Driving Car, Geolocate images/cameras, Twitter, Crowd Sourcing, Network Science, NIST benchmark datasets • The Ecosystem for Research(4): Metadata, Collaboration, Language Translation, Light source experiments • Astronomy and Physics(5): Sky Surveys including comparison to simulation, Large Hadron Collider at CERN, Belle Accelerator II in Japan • Earth, Environmental and Polar Science(10): Radar Scattering in Atmosphere, Earthquake, Ocean, Earth Observation, Ice sheet Radar scattering, Earth radar mapping, Climate simulation datasets, Atmospheric turbulence identification, Subsurface Biogeochemistry (microbes to watersheds), AmeriFlux and FLUXNET gas sensors • Energy(1): Smart grid
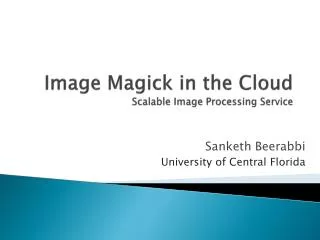
Examples: Especially Image and Internet of Things based Applications
10 Image-based Use Cases • 17:Pathology Imaging/ Digital Pathology: PP, LML, MR for search becoming terabyte 3D images, Global Classification • 18&35: Computational Bioimaging (Light Sources): PP, LML Also materials • 26: Large-scale Deep Learning: GMLStanford ran 10 million images and 11 billion parameters on a 64 GPU HPC; vision (drive car), speech, and Natural Language Processing • 27: Organizing large-scale, unstructured collections of photos: GMLFit position and camera direction to assemble 3D photo ensemble • 36: Catalina Real-Time Transient Synoptic Sky Survey (CRTS): PP, LMLfollowed by classification of events (GML) • 43: Radar Data Analysis for CReSIS Remote Sensing of Ice Sheets: PP, LML to identify glacier beds; GML for full ice-sheet • 44: UAVSAR Data Processing, Data Product Delivery, and Data Services: PP to find slippage from radar images • 45, 46: Analysis of Simulation visualizations: PP LML ?GML find paths, classify orbits, classify patterns that signal earthquakes, instabilities, climate, turbulence
Healthcare Life Sciences 17:Pathology Imaging/ Digital Pathology I • Application: Digital pathology imaging is an emerging field where examination of high resolution images of tissue specimens enables novel and more effective ways for disease diagnosis. Pathology image analysis segments massive (millions per image) spatial objects such as nuclei and blood vessels, represented with their boundaries, along with many extracted image features from these objects. The derived information is used for many complex queries and analytics to support biomedical research and clinical diagnosis. Streaming Parallelism over Images MR, MRIter, PP, Classification
Healthcare Life Sciences 17:Pathology Imaging/ Digital Pathology II • Current Approach: 1GB raw image data + 1.5GB analytical results per 2D image. MPI for image analysis; MapReduce + Hive with spatial extension on supercomputers and clouds. GPU’s used effectively. Figure below shows the architecture of Hadoop-GIS, a spatial data warehousing system over MapReduce to support spatial analytics for analytical pathology imaging. • Futures: Recently, 3D pathology imaging is made possible through 3D laser technologies or serially sectioning hundreds of tissue sections onto slides and scanning them into digital images. Segmenting 3D microanatomic objects from registered serial images could produce tens of millions of 3D objects from a single image. This provides a deep “map” of human tissues for next generation diagnosis. 1TB raw image data + 1TB analytical results per 3D image and 1PB data per moderated hospital per year. Architecture of Hadoop-GIS, a spatial data warehousing system over MapReduce to support spatial analytics for analytical pathology imaging
26: Large-scale Deep Learning • Application: Large models (e.g., neural networks with more neurons and connections) combined with large datasets are increasingly the top performers in benchmark tasks for vision, speech, and Natural Language Processing. One needs to train a deep neural network from a large (>>1TB) corpus of data (typically imagery, video, audio, or text). Such training procedures often require customization of the neural network architecture, learning criteria, and dataset pre-processing. In addition to the computational expense demanded by the learning algorithms, the need for rapid prototyping and ease of development is extremely high. • Current Approach: Thelargest applications so far are to image recognition and scientific studies of unsupervised learning with 10 million images and up to 11 billion parameters on a 64 GPU HPC Infiniband cluster. Both supervised (using existing classified images) and unsupervised applications • Futures: Large datasets of 100TB or more may be necessary in order to exploit the representational power of the larger models. Training a self-driving car could take 100 million images at megapixel resolution. Deep Learning shares many characteristics with the broader field of machine learning. The paramount requirements are high computational throughput for mostly dense linear algebra operations, and extremely high productivity for researcher exploration. One needs integration of high performance libraries with high level (python) prototyping environments Classified OUT IN Deep Learning, Social Networking GML, EGO, MRIter, Classify
Deep Learning Social Networking 27: Organizing large-scale, unstructured collections of consumer photos I • Application: Produce 3D reconstructions of scenes using collections of millions to billions of consumer images, where neither the scene structure nor the camera positions are known a priori. Use resulting 3d models to allow efficient browsing of large-scale photo collections by geographic position. Geolocate new images by matching to 3d models. Perform object recognition on each image. 3d reconstruction posed as a robust non-linear least squares optimization problem where observed relations between images are constraints and unknowns are 6-d camera pose of each image and 3-d position of each point in the scene. • Current Approach: Hadoop cluster with 480 cores processing data of initial applications. Note over 500 billion images on Facebook and over 5 billion on Flickr with over 500 million images added to social media sites each day. EGO, GIS, MR, Classification Parallelism over Photos
Deep Learning Social Networking 27: Organizing large-scale, unstructured collections of consumer photos II • Futures:Need many analytics including feature extraction, feature matching, and large-scale probabilistic inference, which appear in many or most computer vision and image processing problems, including recognition, stereo resolution, and image denoising. Need to visualize large-scale 3-d reconstructions, and navigate large-scale collections of images that have been aligned to maps.
Astronomy & Physics 36: Catalina Real-Time Transient Survey (CRTS): a digital, panoramic, synoptic sky survey I • Application: The survey explores the variable universe in the visible light regime, on time scales ranging from minutes to years, by searching for variable and transient sources. It discovers a broad variety of astrophysical objects and phenomena, including various types of cosmic explosions (e.g., Supernovae), variable stars, phenomena associated with accretion to massive black holes (active galactic nuclei) and their relativistic jets, high proper motion stars, etc. The data are collected from 3 telescopes (2 in Arizona and 1 in Australia), with additional ones expected in the near future (in Chile). • Current Approach: The survey generates up to ~ 0.1 TB on a clear night with a total of ~100 TB in current data holdings. The data are preprocessed at the telescope, and transferred to Univ. of Arizona and Caltech, for further analysis, distribution, and archiving. The data are processed in real time, and detected transient events are published electronically through a variety of dissemination mechanisms, with no proprietary withholding period (CRTS has a completely open data policy). Further data analysis includes classification of the detected transient events, additional observations using other telescopes, scientific interpretation, and publishing. In this process, it makes a heavy use of the archival data (several PB’s) from a wide variety of geographically distributed resources connected through the Virtual Observatory (VO) framework. PP, ML, Classification Streaming Parallelism over Images and Events: Celestial events identified in Telescope Images
Astronomy & Physics 36: Catalina Real-Time Transient Survey (CRTS): a digital, panoramic, synoptic sky survey I • Futures: CRTS is a scientific and methodological testbed and precursor of larger surveys to come, notably the Large Synoptic Survey Telescope (LSST), expected to operate in 2020’s and selected as the highest-priority ground-based instrument in the 2010 Astronomy and Astrophysics Decadal Survey. LSST will gather about 30 TB per night.
35: Light source beamlines • Application: Samples are exposed to X-rays from light sources in a variety of configurations depending on the experiment. Detectors (essentially high-speed digital cameras) collect the data. The data are then analyzed to reconstruct a view of the sample or process being studied. • Current Approach: A variety of commercial and open source software is used for data analysis – examples including Octopus for Tomographic Reconstruction, Avizo (http://vsg3d.com) and FIJI (a distribution of ImageJ) for Visualization and Analysis. Data transfer is accomplished using physical transport of portable media (severely limits performance) or using high-performance GridFTP, managed by Globus Online or workflow systems such as SPADE. • Futures:Camera resolution is continually increasing. Data transfer to large-scale computing facilities is becoming necessary because of the computational power required to conduct the analysis on time scales useful to the experiment. Large number of beamlines (e.g. 39 at LBNL ALS) means that total data load is likely to increase significantly and require a generalized infrastructure for analyzing gigabytes per second of data from many beamline detectors at multiple facilities. Research Ecosystem PP, LML, Streaming
Earth, Environmental and Polar Science 43: Radar Data Analysis for CReSIS Remote Sensing of Ice Sheets IV • Typical CReSIS echogram with Detected Boundaries. The upper (green) boundary is between air and ice layer while the lower (red) boundary is between ice and terrain Streaming Parallelism over Radar Images PP, GIS
Earth, Environmental and Polar Science 44: UAVSAR Data Processing, Data Product Delivery, and Data Services II • Combined unwrapped coseismic interferograms for flight lines 26501, 26505, and 08508 for the October 2009 – April 2010 time period. End points where slip can be seen on the Imperial, Superstition Hills, and Elmore Ranch faults are noted. GPS stations are marked by dots and are labeled. PP, GIS Streaming Parallelism over Radar Images
Internet of Things and Streaming Apps • It is projected that there will be 24 (Mobile Industry Group) to 50 (Cisco) billion deviceson the Internet by 2020. • Thecloud natural controller of and resource provider for the Internet of Things. • Smart phones/watches, Wearable devices (Smart People), “Intelligent River” “Smart Homes and Grid” and “Ubiquitous Cities”, Robotics. • Majority of use cases are streaming – experimental science gathers data in a stream – sometimes batched as in a field trip. Below is sample • 10: Cargo Shipping Tracking as in UPS, FedexPP GIS LML • 13: Large Scale Geospatial Analysis and Visualization PP GIS LML • 28: Truthy: Information diffusion research from Twitter Data PP MR for Search, GML for community determination • 39: Particle Physics: Analysis of LHC Large Hadron Collider Data: Discovery of Higgs particle PP Local Processing Global statistics • 50: DOE-BER AmeriFlux and FLUXNET Networks PP GIS LML • 51: Consumption forecasting in Smart Grids PP GIS LML
SS Database SS SS SS SS SS DiscoveryCloud DiscoveryCloud FilterCloud FilterCloud FilterCloud FilterCloud FilterCloud FilterCloud FilterCloud FilterCloud FilterCloud FilterCloud ComputeCloud StorageCloud SS SS SS SS SS SS Raw Data Data Information Knowledge Wisdom Decisions AnotherGrid SS SS SS SS SS Portal Fusion for Discovery/Decisions AnotherService SS: Sensor or Data Interchange Service Workflow through multiple filter/discovery clouds AnotherCloud SS SS SS SS SS SS SS SS DistributedGrid Hadoop Cluster
IOTCloud • Device Pub-SubStorm Datastore Data Analysis • Apache Storm provides scalable distributed system for processing data streams coming from devices in real time. • For example Storm layer can decide to store the data in cloud storage for further analysis or to send control data back to the devices • Evaluating Pub-Sub Systems ActiveMQ, RabbitMQ, Kafka, Kestrel Turtlebot and Kinect
PerformanceFrom Device to Cloud • 6 FutureGrid India Medium OpenStack machines • 1 Broker machine, RabbitMQ or ActiveMQ • 1 machine hosting ZooKeeper and Storm – Nimbus (Master for Storm) • 2 Sensor sites generating data • 2 Storm nodes sending back the same data and we measure the unidirectional latency • Using drones and Kinects
10: Cargo Shipping Architecture Commercial Industry Standards Continuous Tracking PP Streaming
Earth, Environmental and Polar Science 50: DOE-BER AmeriFlux and FLUXNET Networks • Application:AmeriFlux and FLUXNET are US and world collections respectively of sensors that observe trace gas fluxes (CO2, water vapor) across a broad spectrum of times (hours, days, seasons, years, and decades) and space. Moreover, such datasets provide the crucial linkages among organisms, ecosystems, and process-scale studies—at climate-relevant scales of landscapes, regions, and continents—for incorporation into biogeochemical and climate models. • Current Approach:Software includes EddyPro, Custom analysis software, R, python, neural networks, Matlab. There are ~150 towers in AmeriFlux and over 500 towers distributed globally collecting flux measurements. • Futures:Field experiment data taking would be improved by access to existing data and automated entry of new data via mobile devices. Need to support interdisciplinary study integrating diverse data sources. Fusion, PP, GIS Streaming Parallelism over Sensors
Energy 51: Consumption forecasting in Smart Grids • Application: Predict energy consumption for customers, transformers, sub-stations and the electrical grid service area using smart meters providing measurements every 15-mins at the granularity of individual consumers within the service area of smart power utilities. Combine Head-end of smart meters (distributed), Utility databases (Customer Information, Network topology; centralized), US Census data (distributed), NOAA weather data (distributed), Micro-grid building information system (centralized), Micro-grid sensor network (distributed). This generalizes to real-time data-driven analytics for time series from cyber physical systems • Current Approach: GIS based visualization. Data is around 4 TB a year for a city with 1.4M sensors in Los Angeles. Uses R/Matlab, Weka, Hadoop software. Significant privacy issues requiring anonymization by aggregation. Combine real time and historic data with machine learning for predicting consumption. • Futures: Wide spread deployment of Smart Grids with new analytics integrating diverse data and supporting curtailment requests. Mobile applications for client interactions. Streaming Parallelism over Sensors Fusion, PP, MR, ML, GIS, Classification
Deep Learning Social Networking 28: Truthy: Information diffusion research using Twitter Data • Application: Understanding how communication spreads on socio-technical networks. Detecting potentially harmful information spread at the early stage (e.g., deceiving messages, orchestrated campaigns, untrustworthy information, etc.) • Current Approach: 1) Acquisition and storage of a large volume (30 TB a year compressed) of continuous streaming data from Twitter (~100 million messages per day, ~500GB data/day increasing over time); (2) near real-time analysis of such data, for anomaly detection, stream clustering, signal classification and online-learning; (3) data retrieval, big data visualization, data-interactive Web interfaces, public API for data querying. Use Python/SciPy/NumPy/MPI for data analysis. Information diffusion, clustering, and dynamic network visualization capabilities already exist • Futures:Truthy plans to expand incorporating Google+ and Facebook. Need to move towards Hadoop/IndexedHBase & HDFS distributed storage. Previously used Redis as an in-memory database to be a buffer for real-time analysis. Need streaming clustering, anomaly detection and online learning. Index, S/Q, MR, MRIter, Graph, Classification Streaming Parallelism over Tweets
Distributed Computing Practice for Large-Scale Science & Engineering S. Jha, M. Cole, D. Katz, O. Rana, M. Parashar, and J. Weissman, • Work of
10 Enterprise DB Generic Use Cases • Multiple users performing interactive queries and updates on a database with basic availability and eventual consistency (BASE) • Perform real time analytics on data source streams and notify users when specified events occur • Move data from external data sources into a highly horizontally scalable data store, transform it using highly horizontally scalable processing (e.g. Map-Reduce), and return it to the horizontally scalable data store (ELT) • Perform batch analytics on the data in a highly horizontally scalable data store using highly horizontally scalable processing (e.gMapReduce) with a user-friendly interface (e.g. SQL like) • Perform interactive analytics on data in analytics-optimized database • Visualize data extracted from horizontally scalable Big Data store • Move data from a highly horizontally scalable data store into a traditional Enterprise Data Warehouse • Extract, process, and move data from data stores to archives • Combine data from Cloud databases and on premise data stores for analytics, data mining, and/or machine learning • Orchestrate multiple sequential and parallel data transformations and/or analytic processing using a workflow managerThese consist of multiple data systems including classic DB, streaming, archives, Hive, analytics, workflow and different user interfaces (events to visualization)
10 Security & Privacy Use Cases • Consumer Digital Media Usage • Nielsen Homescan • Web Traffic Analytics • Health Information Exchange • Personal Genetic Privacy • PharmaClinic Trial Data Sharing • Cyber-security • Aviation Industry • Military - Unmanned Vehicle sensor data • Education - “Common Core” Student Performance Reporting
7 Computational Giants of NRC Massive Data Analysis Report • G1: Basic Statistics e.g. MRStat • G2: Generalized N-Body Problems • G3: Graph-Theoretic Computations • G4: Linear Algebraic Computations • G5:Optimizations e.g. Linear Programming • G6:Integration e.g. LDA and other GML • G7: Alignment Problems e.g. BLAST
Would like to capture “essence of these use cases” “small” kernels, mini-apps Or Classify applications into patterns Do it from HPC background not database viewpoint e.g. focus on cases with detailed analytics Section 5 of my class https://bigdatacoursespring2014.appspot.com/previewclassifies 51 use cases with ogre facets
HPC Benchmark Classics • Linpackor HPL: Parallel LU factorization for solution of linear equations • NPB version 1: Mainly classic HPC solver kernels • MG: Multigrid • CG: Conjugate Gradient • FT: Fast Fourier Transform • IS: Integer sort • EP: Embarrassingly Parallel • BT: Block Tridiagonal • SP: Scalar Pentadiagonal • LU: Lower-Upper symmetric Gauss Seidel
13 Berkeley Dwarfs First 6 of these correspond to Colella’s original. Monte Carlo dropped. N-body methods are a subset of Particle in Colella. Note a little inconsistent in that MapReduce is a programming model and spectral method is a numerical method. Need multiple facets! • Dense Linear Algebra • Sparse Linear Algebra • Spectral Methods • N-Body Methods • Structured Grids • Unstructured Grids • MapReduce • Combinational Logic • Graph Traversal • Dynamic Programming • Backtrack and Branch-and-Bound • Graphical Models • Finite State Machines
Problem Architecture Facet of Ogres (Meta or MacroPattern) • Pleasingly Parallel – as in BLAST, Protein docking, some (bio-)imagery including Local Analytics or Machine Learning – ML or filtering pleasingly parallel, as in bio-imagery, radar images (pleasingly parallel but sophisticated local analytics) • Classic MapReduce: Search, Index and Query and Classification algorithms like collaborative filtering (G1 for MRStat in Table 2, G7) • Global Analytics or Machine Learning requiring iterative programming models (G5,G6). Often from • Maximum Likelihood or 2minimizations • Expectation Maximization (often Steepest descent) • Problem set up as a graph (G3) as opposed to vector, grid • SPMD: Single Program Multiple Data • BSP or Bulk Synchronous Processing: well-defined compute-communication phases • Fusion: Knowledge discovery often involves fusion of multiple methods. • Workflow: All applications often involve orchestration (workflow) of multiple components • Use Agents: as in epidemiology (swarm approaches) Note problem and machine architectures are related
One Facet of Ogres has Computational Features • Flops per byte; • Communication Interconnect requirements; • Is application (graph) constant or dynamic? • Most applications consist of a set of interconnected entities; is this regular as a set of pixels or is it a complicated irregular graph? • Is communication BSP, Asynchronous, Pub-Sub, Collective, Point to Point? • Are algorithms Iterative or not? • Are algorithms governed by dataflow • Data Abstraction: key-value, pixel, graph, vector • Are data points in metric or non-metric spaces? • Is algorithm O(N2) or O(N) (up to logs) for N points per iteration (G2) • Core libraries needed: matrix-matrix/vector algebra, conjugate gradient, reduction, broadcast
Data Source and Style Facet of Ogres I • (i) SQL or NoSQL: NoSQL includes Document, Column, Key-value, Graph, Triple store • (ii) Other Enterprise data systems: 10 examples from NIST integrate SQL/NoSQL • (iii) Set of Files: as managed in iRODS and extremely common in scientific research • (iv) File, Object, Block and Data-parallel (HDFS) raw storage: Separated from computing? • (v) Internet of Things: 24 to 50 Billion devices on Internet by 2020 • (vi) Streaming: Incremental update of datasets with new algorithms to achieve real-time response (G7) • (vii) HPC simulations: generate major (visualization) output that often needs to be mined • (viii) Involve GIS: Geographical Information Systems provide attractive access to geospatial data
Data Source and Style Facet of Ogres II • Before data gets to compute system, there is often an initial data gathering phase which is characterized by a block size and timing. Block size varies from month (Remote Sensing, Seismic) to day (genomic) to seconds or lower (Real time control, streaming) • There are storage/compute system styles: Shared, Dedicated, Permanent, Transient • Other characteristics are needed for permanent auxiliary/comparison datasetsand these could be interdisciplinary, implying nontrivial data movement/replication
Core Analytics Ogres (microPattern) I • Map-Only • Pleasingly parallel - Local Machine Learning • MapReduce: Search/Query/Index • Summarizing statistics as in LHC Data analysis (histograms) (G1) • Recommender Systems (Collaborative Filtering) • Linear Classifiers (Bayes, Random Forests) • Alignment and Streaming (G7) • Genomic Alignment, Incremental Classifiers • Global Analytics • Nonlinear Solvers (structure depends on objective function)(G5,G6) • Stochastic Gradient Descent SGD • (L-)BFGS approximation to Newton’s Method • Levenberg-Marquardt solver
Core Analytics Ogres (microPattern) II • Map-Collective (See Mahout, MLlib) (G2,G4,G6) • Often use matrix-matrix,-vector operations, solvers (conjugate gradient) • Outlier Detection, Clustering (many methods), • Mixture Models, LDA (Latent Dirichlet Allocation), PLSI (Probabilistic Latent Semantic Indexing) • SVM and Logistic Regression • PageRank, (find leading eigenvector of sparse matrix) • SVD (Singular Value Decomposition) • MDS (Multidimensional Scaling) • Learning Neural Networks (Deep Learning) • Hidden Markov Models
Core Analytics Ogres (microPattern) III • Global Analytics – Map-Communication (targets for Giraph) (G3) • Graph Structure (Communities, subgraphs/motifs, diameter, maximal cliques, connected components) • Network Dynamics - Graph simulation Algorithms (epidemiology) • Global Analytics – Asynchronous Shared Memory (may be distributed algorithms) • Graph Structure (Betweenness centrality, shortest path) (G3) • Linear/Quadratic Programming, Combinatorial Optimization, Branch and Bound (G5)
Lessons / Insights • Proposed classification of Big Data applications with features and kernels for analytics • Add other Ogres for workflow, data systems etc. • Looked at Image-based and Streaming Big Data Problems • Data intensive algorithms do not have the well developed high performance libraries familiar from HPC • Challenges with O(N2) problems • Global Machine Learning or (Exascale Global Optimization) particularly challenging