Download
1 / 1
10 likes | 113 Views
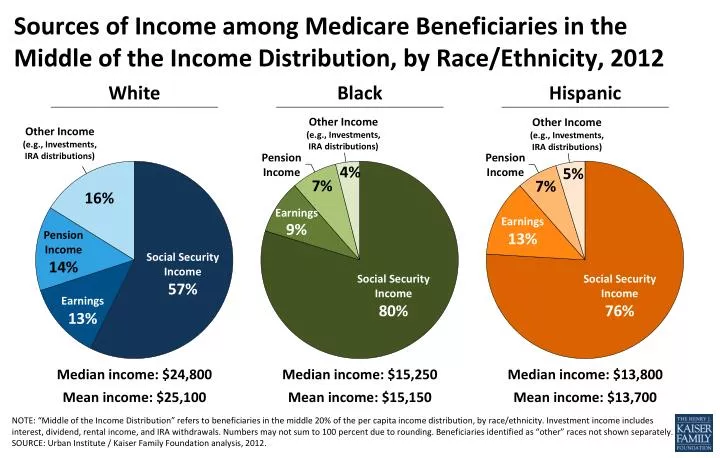
Sources of Income among Medicare Beneficiaries in the Middle of the Income Distribution, by Race/Ethnicity, 2012. Other Income (e.g., Investments, IRA distributions). Other Income (e.g., Investments, IRA distributions). Other Income (e.g., Investments, IRA distributions).

E N D
Sources of Income among Medicare Beneficiaries in the Middle of the Income Distribution, by Race/Ethnicity, 2012 Other Income (e.g., Investments, IRA distributions) Other Income (e.g., Investments, IRA distributions) Other Income (e.g., Investments, IRA distributions) Pension Income Pension Income 4% 5% 7% 7% 16% Earnings 9% Earnings 13% Pension Income 14% Social Security Income 57% Social Security Income 80% Social Security Income 76% Earnings 13% NOTE: “Middle of the Income Distribution” refers to beneficiaries in the middle 20% of the per capita income distribution, by race/ethnicity. Investment income includes interest, dividend, rental income, and IRA withdrawals. Numbers may not sum to 100 percent due to rounding. Beneficiaries identified as “other” races not shown separately. SOURCE: Urban Institute / Kaiser Family Foundation analysis, 2012.