Download
1 / 60
600 likes | 604 Views
This article discusses the high temperature and heavy rainfall events that occurred in Shanghai in 2009, including the impact on the city's infrastructure and transportation systems. It also explores the climate patterns and weather phenomena associated with these events.

E N D
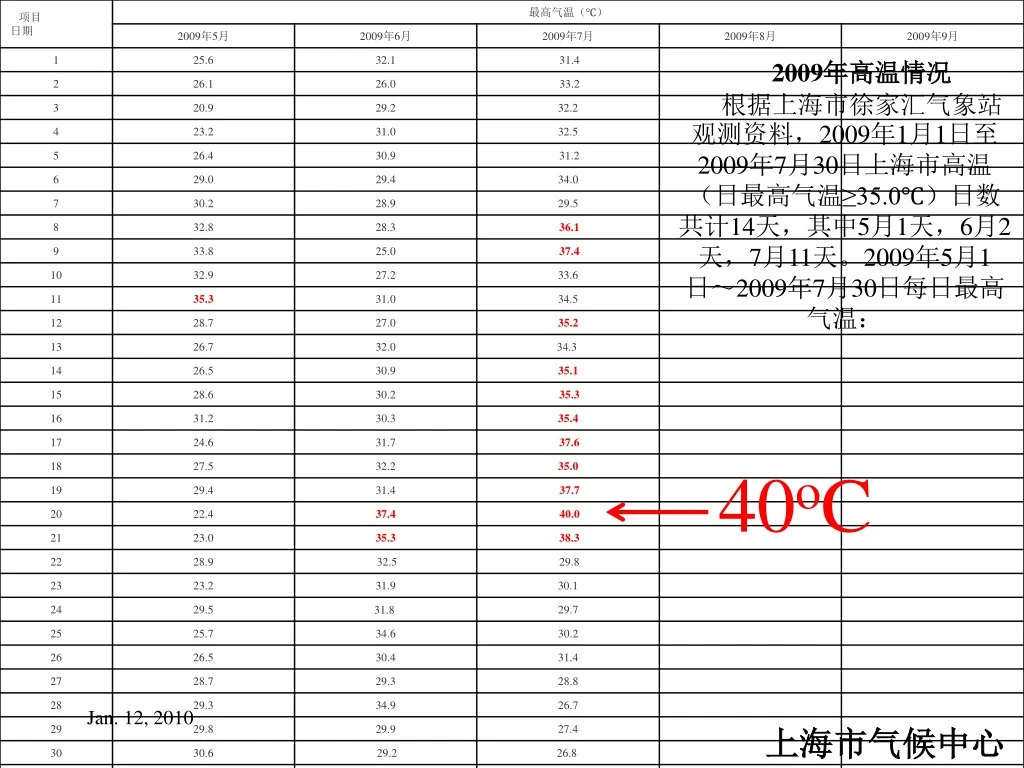
2009年高温情况 根据上海市徐家汇气象站观测资料,2009年1月1日至2009年7月30日上海市高温(日最高气温≥35.0℃)日数共计14天,其中5月1天,6月2天,7月11天。2009年5月1日~2009年7月30日每日最高气温: 40oC 上海市气候中心
The "heaviest rains in 70 years" lashed Shanghai, China Thursday, July 30, 2009 Heavy rains flood Shanghai Thu Jul 30, 1:19 pm ET BEIJING (AFP) – The "heaviest rains in 70 years" lashed Shanghai Thursday, flooding 3,000 homes and leaving nearly 2,000 travellers stranded at the city's airports, state media reported. Between 80 to 140 millimetres (three to 5.5 inches) fell in most areas of China's largest city, official news agency Xinhua reported, adding that vehicles had been damaged by falling branches. No casualties were reported. More than 500 workers were deployed to clear the water, which was up to 30 centimetres deep on city roads, the report said. The weather delayed scores of flights to and from Shanghai's Pudong and Hongqiao airports, Xinhua said, stranding thousands of passengers. Torrential downpours have struck various parts of China during the annual summer rainy season. Earlier this month Xinhua reported that the heavy rains had displaced more than 100,000 people in Sichuan province in the southwest. AFP/File – A man rides a bicycle through a flooded street after a heavy storm in Shanghai. The "heaviest rains …
Rainfall and Ocean Surface Wind Speed in the Nested Regional Climate Model Hsiao-ming Hsu National Center for Atmospheric Research/ NCAR Earth System Laboratory hsu@ucar.edu
Global climate Regional climate Downscaling
Global climate Regional climate • Downscaling • Stochastic downscaling • Dynamic downscaling
Global climate Regional climate • Downscaling • Stochastic downscaling • Dynamic downscaling • Numerical modeling
Nested Regional Climate Model (NRCM) Advanced Research WRF (ARW) Tropical Channel (Δ = 36 km) (30oS ~ 45oN)/ 36 vertical levels (50 mb) (1996 – 2000) (45oS ~ 45oN)/ 51 vertical levels (10 mb) (2000 – 2005) Δ = 36 km/ 12 km/ 4 km (Jan – Jun, 1997)
Model Evaluations • Rainfall • Ocean surface wind speeds Nested Regional Climate Model (NRCM) Advanced Research WRF (ARW) • Observations (Satellites) • TRMM + IR • QuickSCAT
Model Evaluations • Rainfall • Ocean surface wind speeds Nested Regional Climate Model (NRCM) Advanced Research WRF (ARW) • Observations (Satellites) • TRMM + IR • QuickSCAT Statistical Regularity
Model Evaluations • Rainfall • Ocean surface wind speeds Nested Regional Climate Model (NRCM) Advanced Research WRF (ARW) • Observations (Satellites) • TRMM + IR • QuickSCAT Statistical Regularity PDF and spectra
NRCM Δ = 36 km/ 12 km/ 4 km (Jan – Jun, 1997) Hourlyrainfall
NRCM Δ = 36 km/ 12 km/ 4 km (Jan – Jun, 1997) Hourlyrainfall D03 (Δ=4 km) D02 (Δ=12 km) D01 (Δ=36 km)
Time series D01 D02 D03 Aerial averages Aerial variances Figure 3-2
Temporal spectra D01 D02 D03 Continuous wavelet transform (Morlet wavelets) Dual exponents: -4/3 and -3~-4 Figure 3-4
NRCM Δ = 36 km/ 12 km/ 4 km (Jan – Jun, 1997) Hourlyrainfall D03 (Δ=4 km) D02 (Δ=12 km) D01 (Δ=36 km)
PDF D01 D02 D03 Figure 3-3
Spatial spectra D01 D02 D03 2D Fast Fourier transform & Azimuthal averaging Dual exponents: -1/3~-1 and -3 Figure 3-5
Spatial spectra D01 D02 D03 #10 900 km #23 400 km #15 400 km #111 54 km #10 400 km #74 54 km Figure 3-5
Temporal spectra D01 D02 D03 Continuous wavelet transform (Morlet wavelets) Dual exponents: -4/3 and -4 -4/3 and ….. Figure 3-6
Exponents of temporal spectra D01 D02 D03 Figure 3-7
Summary: • Power-law scaling in both space and time • Dual exponents • Tightly coupled in space and time
D01 D02 D03 GSFC 3B41 Mar. 2002 To Feb. 2004 West East
Time series Aerial averages Aerial variances Figure 4-1
Temporal spectra D01 D02 D03 Figure 4-3
D01 D02 D03 West East
PDF West East -1/3 -9
West East -1/3 TRMM -9 ARW Figure 4-2
Spatial spectra East West 2D Fast Fourier transform & Azimuthalaveraging Dual exponents: -1/3 and -5/3
Spatial spectra West East #06 900 km #16 400 km #100 54 km Figure 4-4
Temporal spectra Dual exponents: -4/3 and ….. Figure 4-5
West East Figure 4-6
Summary: • Power-law scaling in both space and time • Dual exponents • Tightly coupled system in space and time • Tropical rainfall/convection: • REAL multiscale phenomenon
Ocean Surface Wind Speeds Using ARW to Downscale NCEP Winds for Driving Ocean Circulation
Nested Regional Climate Model (NRCM) Advanced Research WRF (ARW) Tropical Channel (30oS ~ 45oN)/ 36 vertical levels (50 mb) (1996 ~ 2000) (45oS ~ 45oN)/ 51 vertical levels (10 mb) (2000 ~ 2005) 36 km/ 12 km/ 4 km
Ocean Surface Wind Speed Analysis QSCAT (0.5o ;~ 60 km) NRCM ( grid; 36 km) CAM3 (T170; ~70 km) NCEP (T62; ~ 200 km) Data: Year 2000 (twice daily)
QSC MEAN
QSC SD
QSC SKEW
QSC KURT
Mean Standard deviation Table 1, Channel and regional averages of the statistical measures, i.e., mean (a, ME) and standard deviation (b, SD) of ocean surface wind speeds. Channel is defined between 40oS and 40oN. Regions are Maritime Continent (MC), North Pacific (NP), South Pacific (SP), North-East Pacific (NEP), North Atlantic (NA), Equatorial Atlantic (EA), South Atlantic (SA), and South Indian (SI). Actual values are in black. Percent differences of measures of NRCM, CAM, or NCEP with respect to QSC’s are in grey.
Skewness Kurtosis Table 1, Channel and regional averages of the statistical measures, i.e., skewness (c, SK), and kurtosis (d, KU) of ocean surface wind speeds. Channel is defined between 40oS and 40oN. Regions are Maritime Continent (MC), North Pacific (NP), South Pacific (SP), North-East Pacific (NEP), North Atlantic (NA), Equatorial Atlantic (EA), South Atlantic (SA), and South Indian (SI). Actual values are in black. Percent differences of measures of NRCM, CAM, or NCEP with respect to QSC’s are in grey.
I II III