Download
1 / 19
190 likes | 285 Views
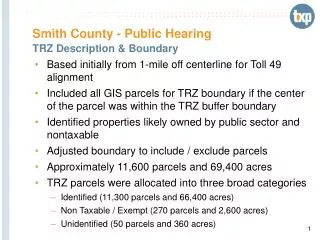
Smith County Schools 2011 Report Card. Smith County School Board Report to County Commission March 12, 2012. Smith County Schools 2011 Report Card. CONTENTS: - Review - Report Card Details - Value-Added Comparisons - New Accountability System & Common Core Standards.

E N D
Smith County Schools2011 Report Card Smith County School Board Report to County Commission March 12, 2012
Smith County Schools2011 Report Card CONTENTS: - Review - Report Card Details - Value-Added Comparisons - New Accountability System & Common Core Standards 2011 Report Card: http://tn.gov/education/reportcard/
2010-11 Report Card - Upper Cumberland Counties (listed in order of enrollment - ADM)
Smith County Making the Grade Achievement / Value-Added Achievement Value-Added Is how much academic growth students made in one year. 0 Growth represents one year’s learning. Value Added is also reported: A, B, C, D & F • This shows how student’s perform against the academic standards. • Is a one time yearly snapshot. • The achievement grades are: A, B, C, D, & F. To learn more about Value-Added, Go to: https://tvaas.sas.com/evaas/welcome.jsf
Representing “Value-Added” Increases in Student Performance Positive Growth: Actual > Predicted Value Added Predicted Student B 0 Growth: Actual = Predicted Negative Growth: Actual < Predicted Value Added Predicted Student A *Red Lines represent predicted student improvement *Blue Lines represent actual student improvement *Value-Added is the increase over what was predicted for student performance
2010 Report Card Smith County Schools TCAP Achievement Grade by Subject by County ( Math, Reading/Language Arts, Social Studies, Science ) B B A B C C B C C D C C C B BB B B A B C C B B B B A A B B A B B BA B B BBB B B A B Trousdale
2011 Report Card Smith County Schools
Smith County TCAP DATA (Just 3 More Points Yields 6 More A’s 21 out of 32 A’s)
Smith County Making the Grade AYP Targets- Elementary/ Middle Percentage of StudentsProficient & Advanced
Smith County Making the Grade Elementary 3-8 AYP h SCMS below Targets 96.2%
Smith County Making the Grade AYP Targets- High School Percentage of StudentsProficient & Advanced
Smith County Making the Grade High School 9-12 AYP 92.4%
Smith County Making the Grade Straight A’s in 2008 & 2009 New Math & RLA Standards 2010
New Accountability System & Common Core Standards Partnership for Assessment of Readiness for College and Careers – PARCC http://www.state.tn.us/education/ http://www.achieve.org/achieving-common-core
Smith County Making the Grade AYP Targets- Elementary/ Middle Percentage of StudentsProficient & Advanced
Smith County Schools2011 Report Card CONTENTS: - Review - Report Card Details - Value-Added Comparisons - New Accountability System & Common Core Standards 2011 Report Card: http://tn.gov/education/reportcard/ http://www.state.tn.us/education/ http://www.achieve.org/achieving-common-core