Download
1 / 15
150 likes | 155 Views
8-1 Estimation Estimating μ when σ is Known. Determine some z scores. Determine the z score so that 70% of any data set will fall between z and –z. Determine the z score so that 75% of any data set will fall between z and –z.

E N D
Determine some z scores Determine the z score so that 70% of any data set will fall between z and –z. Determine the z score so that 75% of any data set will fall between z and –z. Determine the z score so that 80% of any data set will fall between z and –z. Determine the z score so that 90% of any data set will fall between z and –z. Determine the z score so that 99% of any data set will fall between z and –z.
What use is this? Confidence – being relatively sure that data falls in a certain area. When and s are known, the idea here is to be reasonably* sure that μ is nearby. * reasonably sure tends to be a matter of opinion, but we will generally define it later
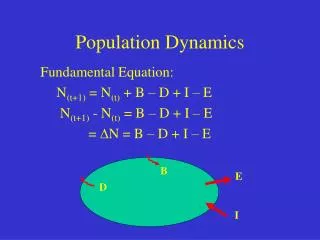
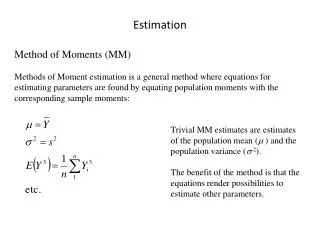
Assumptions Simple random sample, size n, from population of x values σ is known If x distribution is normal, this method works If x distribution is unknown, n ≥ 30 If x distribution is skewed or not mound shaped, n will need to be even higher. is called the point estimate of μ Margin of error is | ― μ| (magnitude of ― μ)
Confidence Level The reliability of the estimate The confidence interval is the area where you can state with a certain level of confidence (c) that the mean lies. There will be critical values so that the area from –zc to zc will be equal to c
This will look confusing But use logic…
This will look confusing But use logic…
This will look confusing But use logic…
This will look confusing But use logic… Remember also that zc and –zc are the boundaries … therefore
Therefore If –zc and zc are the boundaries, then we can rewrite the equation to be
Therefore If –zc and zc are the boundaries, then we can rewrite the equation to be And we can call the margin of error
Ergo And a little algebra lets us turn this into c is your confidence level – 95%, 93%, whatever…
Ergo And a little algebra lets us turn this into c is your confidence level – 95%, 93%, whatever…
Practice problem In the third week of July, a random sample of 40 farming regions gave a sample mean of $6.88 per 100 lbs of watermelon. Assume that σ is known to be $1.92 per 100 lbs. A) Find the 90% confidence interval for the population mean price per 100 lbs that farmers in this region get for their watermelon crop. What is E? B) A farm brings 15 tons of watermelon to the market. Find a 90% confidence interval for the population mean cash value of this crop. What is the margin of error?
Calculator Slide As usual, some by hand…. But when you need to use the calculator STAT: TESTS 7: Zinterval Now if you chose Stats then you will toggle down and type in the information you have. If you choose Data, then you have to refer to the list (but still put in σ). C level refers to confidence level