Download
1 / 13
130 likes | 252 Views
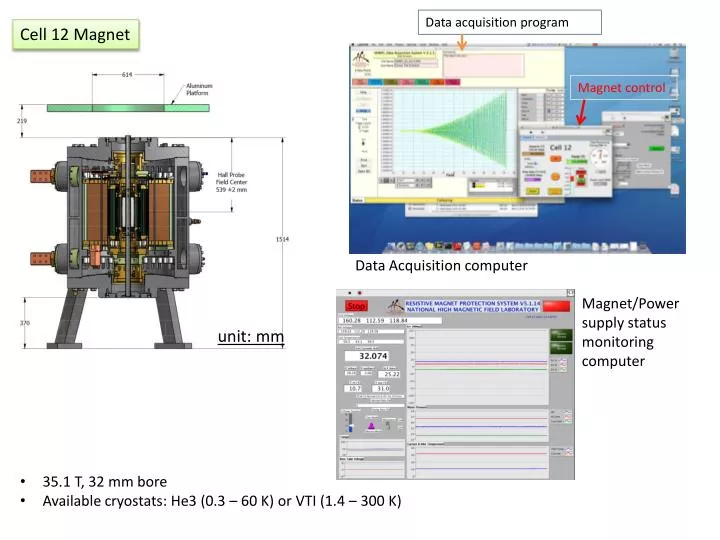
Cell 12 Magnet. Data acquisition program. Magnet control. Data Acquisition computer. Magnet/Power supply status monitoring computer. unit: mm. 35.1 T, 32 mm bore Available cryostats: He3 (0.3 – 60 K) or VTI (1.4 – 300 K). System D Rotator Probe. Side A. Side B. Before mounting.

E N D
Cell 12 Magnet Data acquisition program Magnet control Data Acquisition computer Magnet/Power supply status monitoring computer unit: mm • 35.1 T, 32 mm bore • Available cryostats: He3 (0.3 – 60 K) or VTI (1.4 – 300 K)
System D Rotator Probe Side A Side B Before mounting Sample holder mounted on the probe Sample holder : side A side view • Sr2RuO4 • Magnetic torque • Capacitance between the two parallel plates top view
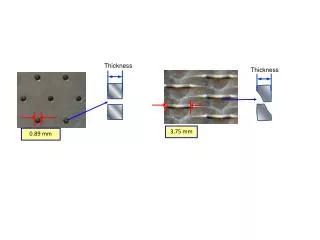
11.4 mm Sample holder : side B • SrMnBi2 • Electrical transport • Resistance (Rxx) 0.25 mm • Ba2Fe2As2 • Surface conductivity • TDO (Tunnel Diode Oscillator) resonance freq. shift • PdCoO2 • Magnetic torque • Resistance change of piezo-resistive device • Hall sensor (THS 118: GaAs based) • Hall Resistance (Rxy) 1.5 mm
Sr2RuO4 Triplet superconductor (Tc = 1.4 K) Torque: Capacitance signal, T= 30 mK C. Bergemannet al., PhysicaB 294, 371 (2001)
BaFe2As2 Parent compound of 122 pnictide superconductors TDO frequency shift 30 mK 350 mK D. E. Graf et al., PRB 85, 134503 (2012) J. G. Analytis et al., PRB 80, 064507 (2009)
SrMnBi2 Dirac Fermion compound CaMnBi2 SrMnBi2 J. Park et al., PRL 107 126402 (2011) K. Wang et al., PRB 85 041101(R) (2012)
PdCoO2 Metallic triangular lattice compound Torque signal (piezo-cantilever) T=0.7 K C. W. Hicks et al., PRL 109 116401 (2012)
Measurement techniques • Resistance measurements by instrumentation (Rxx, Rxy, piezo-cantilever) • principle: apply current (current source) and measure voltage (voltmeter) • Conventional lock-in amplifier technique • Oscillating current applied, phase sensitive detection of corresponding voltage • DC resistance measurement technique • DC current with switching polarities to remove offset • AC resistance bridge • Resistance determined by nulling or measuring unbalanced signal • Q: what is advantage/disadvantage of the lock-in technique compared to the DC technique? • Capacitance measurement for magnetic torque • AH capacitance bridge: automatic balancing • GR capacitance bridge: manual balancing • Q: what other physical properties can be measured by the capacitance measurement device? Typical capacitance bridge TDO resonance frequency measurement
Exercises 1: Resistance measurement on the standard resistor (hints given in the appendix) • Lock-in technique • configure resistance measurement setup with 1 lock-in amplifier (SR 830) • Change parameters (current, frequency, time constant, ..) and check the voltage readings • DC technique • Configure measurement setup with 1 DC current source (Keithley 6221) and 1 DC nanovoltmeter (Keithly 2182) • Apply constant DC current ( < 10 mA) and monitor the voltage • Setup the Delta mode and test with different parameters (current, delay time,..) Exercises 2: Capacitance measurement on the standard capacitor • AH bridge : hook up coax cables to the decade capacitor box and press buttons • (2) GR bridge • configure GR bridge and 1 lockin-amplifer for capacitance measurement • balance the GR bridge to find the capacitance value (should be similar to obtained from (1) • find the conversion factor between lock-in signal and capacitance
Exercises 3: Balancing the piezo-cantilever • Build a measurement circuit with a given bridge circuit box • Balance the bridge inside cryostat Demonstration 1: TDO measurement Exercises 4: Setting up instruments for the real samples Setup instruments for the Hall sensor (DC resistance delta mode) and piezo-cantilever (lock-in technique). Refer to the breakout box diagram in the next page. NOTE: Do not apply currents until further notice. (2) Instructor will setup AC resistance bridge for the transport measurement (3) Connect cables to the AH bridge for the capacitance measurement (4) Using the data acquisition program, collect the data at zero field as a function of time
variable resistor can be used as pseudo-current source setup when combined with lock-in oscillator NHMFL breakout box Exercises 5: Data acquisition Collect data while sweeping magnetic field under different instrumentation setup Collect data at different temperatures Collect data at different angles Exercise/Demonstration: Data analysis • Plot the data using data analysis program • Q1) Plot the temperature vs. magnetic field. Why does temperature reading change with field? Any way to circumvent the problem? • Q2) What is the oscillation frequency of the quantum oscillations? • Q3) Capacitance torque signal from Sr2RuO4 sample look different from the text book (saw-tooth not sinusoidal). Why? • (2) Perform FFT with different settings (field range, different background, FFT windows, …) (answer given in the appendix)
Appendix I Resistance measurement (Lock-in technique) • Oscillator out to the current terminals with a large resistor connected in series • Connect voltage terminals to voltage input (A-B mode) voltage input osc. out sample Current limiting resistor (R) I = V/(Rsample+R) ~ V/R (if R >> Rsample) DC resistance measurement (delta mode) • Configure Delta (picture above) : set I-high, I-low, Delay. ,,,, • Press Delta to arm • Press TRIG to start delta mode operation
Appendix II Torque interaction analysis in Sr2RuO4 by Naoki Kikugawa Sr2RuO4 T = 1.4K B // ~ c axis Data taken at Cell 12 (May 21, 2014) Remember: The oscillation is periodic in 1/B not in 1/H Raw data (before de-torque) FFT: 28 – 34.5T De-torqued FFT: 28 – 34.5 T