Download
1 / 15
150 likes | 352 Views
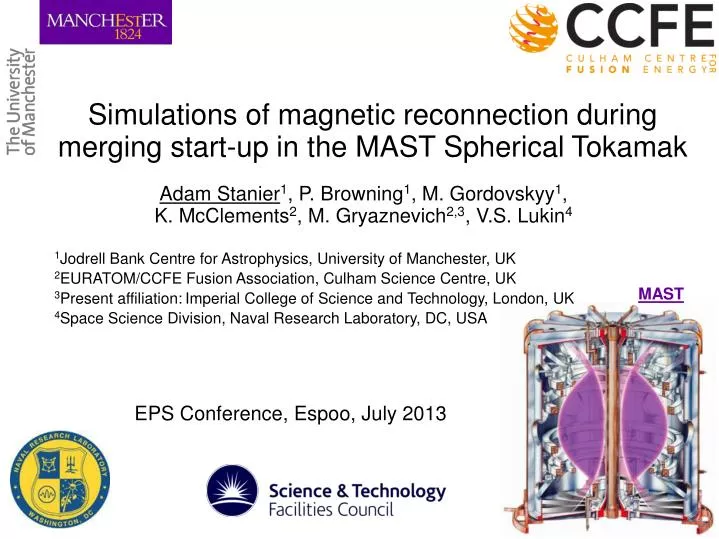
Simulations of magnetic reconnection during merging start-up in the MAST Spherical Tokamak. Adam Stanier 1 , P. Browning 1 , M. Gordovskyy 1 , K. McClements 2 , M. Gryaznevich 2,3 , V.S. Lukin 4. 1 Jodrell Bank Centre for Astrophysics, University of Manchester, UK

E N D
Simulations of magnetic reconnection during merging start-up in the MAST Spherical Tokamak Adam Stanier1, P. Browning1, M. Gordovskyy1, K. McClements2, M. Gryaznevich2,3, V.S. Lukin4 1Jodrell Bank Centre for Astrophysics, University of Manchester, UK 2EURATOM/CCFE Fusion Association, Culham Science Centre, UK 3Present affiliation:Imperial College of Science and Technology, London, UK 4Space Science Division, Naval Research Laboratory, DC, USA MAST EPS Conference, Espoo, July 2013
Why study reconnection in MAST? • Reconnection important energy release mechanism in magnetotail, solar corona. • Can degrade plasma confinement in magnetic fusion energy device. • We can study reconnection in the laboratory under controlled conditions and with many diagnostics. • Several experiments (mostly) dedicated to the study of reconnection: • RSX (LANL), TS-3/4 (University of Tokyo), MRX (Princeton), VTF (MIT) • Merging start-up in the Mega-Ampere Spherical Tokamak is not dedicated, but has stronger magnetic fields and reaches higher temperatures. • High-resolution Thomson scattering system gives detailed profiles of electron temperature and density. Understanding of reconnection in parameter regime relevant to tokamak disruptions. Solar flare: lifetime of active region ~ 1 week, release ~ 1025 J over 100 sec. Tokamak Sawtooth crash: Build up (sawtooth period) ~ 100 ms, crash ~ 100 μs.
Merging start-up • Merging start-up is an attractive alternative for start-up without central solenoid. • Breakdown and current induction around in-vessel P3 coils. • Flux-ropes merge via reconnection at mid-plane to form single Spherical Tokamak (ST) plasma. • Up to 0.5 MA plasma current obtained. • Up to Te = 1 keV achieved in on ms timescale measured with Thomson Scattering (TS) laser. 250 Current (kA.turn) P3 200 Plasma 150 100 50 0 0 1 2 3 4 5 6 Time (ms) Thomson Scattering lasers Pick-up Coil (CCMV20) P3 Typical start-up parameters: Magnetic:Bp = 0.1 T, BT = 0.5 T, IT = 0.2 - 0.5 MA Thermal:Te = Ti = 10 eV, n = 5x10¹⁸ m-3, Deuterium φ φ
Merging start-up Time resolution: 0.1 ms. Total time: ~ 7ms.
Fluid model • Initial Lundquist #:S = 2 x 10⁴ → Collisional Current Sheet (CS) width: δSP ~ 1 cm. • Kinetic scales become important when larger than collisional CS width. • Ion skin depth: di = 15 cm, Electron: de = 0.25 cm, Larmor radius: ρi = ρis = 0.13 cm. βT = 4x10⁻⁵ βp = 10-3 Hyper-resistivity (electron viscosity) • Heat cond.: , ion-stress tensor: • Will vary μ, η and ηH in simulations presented. • Hyper-resistivity is used to set dissipation scale for Whistler waves. • Can (and does) set diffusion scale here by breaking frozen-in condition. • Physically related to an electron viscosity: Anisotropic heat conduction: Hyper-resistivity (anomalous electron viscosity). for • Solved with the HiFi framework (eg. Lukin and Linton) with 4th Order polynomial basis. • Crank-Nicholson time advance (to avoid CFL condition).
Code and initial conditions • Solved in 2D Cartesian and toroidal geometry with spectral-element code HiFi. • 4th Order polynomial basis functions. • Stretched grid: High resolution in current sheet. • Crank-Nicolson (θ = 0.5) time advance. (Glasser and Tang 2004, Lukin 2008). Toroidal (R,φ,Z) • Currently no measurements of flux-rope structure – use idealised flux ropes, IT = 0.27 MA. • Balanced against pinching by BT increase (βp ~ 10-3), individually force-free. • Conducting walls with line-tied vertical flux Bv = -0.03 T. • Radial dependence (1/R) of toroidal field. Grid: ∆Rmin = 0.5mm ∆Zmin = 0.3mm φ • Currently no q-profiles of pre-merged flux-ropes (plan for M9 campaign). • Idealised initial conditions using
Hall-MHD simulation in toroidal geometry Current Sheet (CS) width: δ = 2.4 cm Grid: ∆Zmin = 0.03cm X-point at t = 0 • Final nested flux-surfaces qualitatively similar for Hall-MHD (di=15 cm, shown) and resistive MHD (di=0, not shown). • Resistive MHD runs exhibit flux-rope “sloshing”(eg. Biskamp and Welter 1980), for η ≤ 10-4 due to magnetic pressure pile-up.
Density profiles: Comparison with experiment Experiment: Nd:Yag ne 5.4 ms 5.5 ms 5.6 ms 5.7 ms • Density measured at R = [0.2, 1.2 m], Z = 0.015 m. • Typically has double peak at beginning of merging. Nd:YAG TS laser Hall-MHD Simulation: Density 20 t0 40 t0 60 t0 80 t0 • Simulated density profile has double peak. Outer peak disappears after merging. • What causes the double peak in density?
What causes the double peak in density? • Density “quadrupole” in Cartesian Hall-MHD simulation. • High (low) density regions correspond to negative (positive) parallel electron velocity gradients. Toroidal resistive MHD simulation (see also Kleva et al. 1995). Cartesian Hall-MHD simulation • Resistive MHD simulation in toroidal geometry has inboard (outboard) density peak (cavity). • Bothtwo-fluid effects and toroidal geometry are needed for double peaked profiles in simulation. • MHD: Density peak on inner side, cavitation on outer edge. • Two-fluid: Additional density asymmetry, disappears after merging completion. di = 0.145 m ηH = 10-8 MHD di = 0 High density seperator
Cartesian Hall-MHD: Effect of collisions Scan in hyper-resistivity (collisions) • ηH = 10-6 • Stable. Weaker collisionality • ηH = 10-8 • Island (ejected in toroidal geometry). Grid: ∆Rmin = 4x10⁻⁴ m, ∆Zmin = 2x10⁻⁴ m • ηH = 10-10 • Localised CS: δ = 4.5 mm ρis= 2.9 cm Grid: ∆Rmin = 1x10⁻⁴ m, ∆Zmin = 4x10⁻⁵ m • However, large aspect ratio current sheet is unstable to island formation (for ηH≤ 10-8). • In Cartesian geometry a central island stalls the reconnection. • Stronger BT: weaker density asymmetry. Multiple, shorter wavelength islands. • Order 1 density variations in “quadrupole” structure. • Electrons accelerated in low density regions. • Similar to reduced two-fluid reconnection model of Kleva et al. 1995.
Summary • We use merging start-up in MAST as a magnetic reconnection experiment. • Resistive and Hall-MHD simulations were run in Cartesian and toroidalaxisymmetric geometry. • We find MAST-like nested flux-surfaces after merging completion in toroidal geometry. • Simulated Thomson Scattering density profiles evolve as in experiment. • Three regimes in Hall-MHD simulations: collisional (δ >> ρis), open X-point (δ < ρis) and an intermediate regime that is unstable to island formation (δ ≥ ρis). Future work: Simulations and M9 Campaign (with H. Tanabe and the MAST team) • Measure 2D Ion Temperature profiles, compare with simulations evolving separate ion and electron pressures. • Look for density “quadrupole” with 2D Thomson scattering image. • Compare q-profiles between experiment and simulation. We have also simulated separate ion and electron temperature profiles. (Stanier et al. 2013). • Resistive MHD simulations in the sloshing regime. • Three regimes in Hall-MHD simulations: collisional (δ >> ρis), open X-point (δ < ρis) and intermediate • Tilt of outflow jets, and ion temperature profiles in two-fluid case – signature of two-fluid effects with guide field. • Toroidal geometry has little effect on reconnection process (eg. the reconnection rate) but can modify density profiles. • Simulated 1D density profiles show same time evolution as in TS profiles – motivation to look for density “quadroupole” with 2D measurement. • Resistive MHD simulations in the sloshing regime. • Three regimes in Hall-MHD simulations: collisional (δ >> ρis), open X-point (δ < ρis) and intermediate • Tilt of outflow jets, and ion temperature profiles in two-fluid case – signature of two-fluid effects with guide field. • Toroidal geometry has little effect on reconnection process (eg. the reconnection rate) but can modify density profiles. • Simulated 1D density profiles show same time evolution as in TS profiles – motivation to look for density “quadroupole” with 2D measurement.
Additional: Reconnection rates Resistive MHD • Several studies have shown length-scale ρis = (Te/mi)1/2/Ωci important for fast reconnection with strong BT. • Peak reconnection rate in Hall-MHD for CS width > ρis have (weak) dependence on ηH. • ηH = 10-10 is slow during CS formation, but explosive when width drops below ρis (t=7 t0). t=7 t0 (eg. Kleva et al. 1995., Simakov et al. 2010)
Additional: Numerical grid and convergence 25 cells across CS width NR=360, NZ=540, NP=4 NR=180, NZ=270, NP=4 • Convergence test for simulation with ηH = 10-10 (lowest dissipation scale). • Coarsening by factor of 2 changes peak reconnection rate by only 0.2 %.
Direction of island ejection depends upon radial positions of O-points and X-point Additional slide: q-profile t=60 midplane Vacuum field • Paramagnetic equilibrium (just after merging). • q-profile > 1: Sensible. Should be stable to m=n=1 kink-mode. • Final state current profile qualitatively similar for resistive and Hall-MHD.
Additional: Resistive MHD sloshing • Increase in BT between flux-ropes slows approach. • Large aspect ratio current-sheet: L >> δ (Sweet-Parker). • Initial low-β sheet: c.f.force-free Harris sheet. • Pile-up of BR on sheet edge, and reconnection stalls. • Sloshing of flux-ropes, c.f. coalescence instability. (Biskamp & Welter 1980, Knoll and Chacon 2005) S = 105, mu = 10-3, BT= 0.5 T, a=0.6, Iplasma = 268 kA


![1. 400 m 2. 200(1 + p ) m 3. 200[1 + ( p /2)] m 4. 200[1 + ( p /4)] m 5. zero](https://cdn3.slideserve.com/5442402/slide1-dt.jpg)