Download
1 / 18
180 likes | 294 Views
Exploring the Geo-reactor Hypothesis with Neutrinos. Jelena Maričić KamLAND Collaboration March 24 th 2007 DOANOW Workshop University of Hawai’i. Outline. The geo-reactor hypothesis Limits on the geo-reactor hypothesis with KamLAND experiment

E N D
Exploring the Geo-reactor Hypothesis with Neutrinos Jelena Maričić KamLAND Collaboration March 24th 2007 DOANOW Workshop University of Hawai’i
Outline • The geo-reactor hypothesis • Limits on the geo-reactor hypothesis with KamLAND experiment • Prospects of verifying the geo-reactor hypothesis with future Hanohano experiment • Summary and conclusion
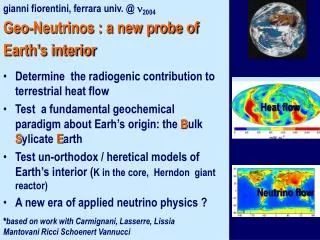
Uranium in the Core? • Radical hypothesis • If it is there, it may undergo fission. • Natural nuclear reactor with power up to 10 TW operating in the center of the Earth, proposed by M. Herndon as the energy source of geo-magnetic field (geo-magnetic field reversals and higher ratios of 3He/4He observed in volcanic plumes in some places). • Although not a mainstream theory, not ruled out by any evidence. • If the geo-reactor exists, its anti-neutrino flux is visible in KamLAND and Hanohano in future!
Why do we Care about Verifying a Radical Hypothesis such as Geo-reactor Sitting in the Earth’s Core? It is a freebie. It can be verified with existing experiments and future planned experiments Geo-reactor Discovered:Does not exist or/and too small: - revolutionize geology - independent check that there are no surprises in the energy region where we do not expect them
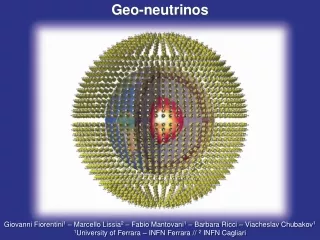
Differentiating between Geo-neutrinos and Geo-reactor Neutrinos • Geo-neutrinos emitted in the decay chains of 40K, 232Th, 238U and can have energies up to 3.4 MeV • Geo-reactor neutrino’s energy spectrum approximately resembles the spectrum of a typical commercial nuclear reactor and these neutrinos may have energies that extend all the way to 9 MeV • Any positive signal above 3.4 MeV limit for geo-neutrinos must be attributed to reactor like neutrinos Inv. reaction: e p+ e+ + n Inverse β-decay energy threshold 1.8 MeV. No geo-neutrinos above 3.4 MeV
Geo-reactor Search with KL • KamLAND detects reactor anti-neutrinos • The possible surplus of detected events implies that there may be another source of anti-neutrinos that have not been accounted for. • Proposed 3-10 TW georeactor ifexists would produce anti-neutrino signal of 4-14% of the KamLAND signal. • The goal is to set an upper limit on the power of the hypothetical geo-reactor. Is it there and if so, how large is it?
Motivation for Geo-reactor Search • Incoming daily flux varies due to nuclear reactors varying work regime. • Rate from the putative geo-reactor very small! • It is assumed that geo-reactor power is constant on the data taking time scale. Survival probability Large error! 90% C.L. KamLAND Time integrated plot Small positive offset of 0.03e/day withVERY LARGE ERROR may be present, for0 ev/dayexpected!Phys.Rev.Lett.94:081801,2005
Confidence Levels on the Geo-reactor Power Very wide minimum The best fit value is 6 TW and 90% C.L. limit is 19 TW Based on 515 days of livetime 0.0102 events/TW·day Comparison of the Best Fit Result with Geological Data
Simulation of the Improving Limits on the Geo-reactor Power with 2.5 more data Rate only No parameter constraints • Simulations with 2.5 more data! • Value of the geo-reactor power treated as a free parameter. R0 = (-6 10) TW R0 = 14 TW at 90%C.L. 90% Rate only + parameter constraints 68% R0 = (-4 5) TW R0 = 9 TW (90%C.L.) 90% 68% Rate + shape + parameter constraints Expectation With 2.5 more data Tightest limit 90% R0 = (0 4) TW R0 = 7 TW (90%C.L.) 68%
Geo-reactor Search with KamLAND Summary • 90% C.L. is 19 TW. • Simulations with 2.5 times more data shows that there will be improvement in the limits, but it is still insufficient to give any final say about the geo-reactor. Based on the simulation: • 90 % C.L. limit will be lowered to 7 TW. • The best fit will be lowered: (0 4) TW • Final result is greatly influenced by: • Error on the input neutrino mixing parameters that will not improve greatly in near future • Background from man-made nuclear reactors that is 10-20 times larger than geo-reactor signal • Detector backgrounds will be decreased by a new radioactive source calibration measurement at KamLAND • KamLAND size detector far away from nuclear reactors needed for high confidence (>99.99%) measurement. • Hawaii presents an excellent choice for a definite geo-reactor measurement ( ). Hanohano
Making a more decisive measurement of geo-neutrinos with future Hanohano experiment
Hano Hano - KamLAND in Ocean • Hano Hano = Hawaii Antineutrino Detector - Hanohano = Hawaiian for “glorious, Distinctive” • Basic Idea: - KamLAND-style anti-neutrino detector in the ocean @ 4km depth - Design: measurement of 238U and 232Th in the mantle - 25% measurement of mantle geo-neutrinos (U/Th) - Will be able to distinguish between different geological models of the Earth. • Will be able to detect geo-reactor neutrinos from the 1 TW or larger geo-reactor if one exists with > 4 C.L.
Planned Detector Design and Location - Designed as 10 kton liquid scintillator detector. - Detection reaction: Oahu Pier construction constraint! Big Island Hanohano 4 km depth
Why Hawaii Represents Such a Good Location for Geo-reactor Detection Commercial nuclear reactor background • Japan presents one of the worst locations for the geo-reactor detection while Hawaii presents one of the best locations for geo-reactor detection. Commercial nuclear reactor background Japan Hawaii
Significance and Signals for the Geo-reactor Detection • Signal significance: σ = S / √(S+B) • Background rate: • 30 events per 10 kT-y (3.4 < Eν(MeV) < 9.3) • 1 TW geo-reactor signal • 38 events per 10 kT-y (3.4 < Eν(MeV) < 9.3) • If the goals for backgrounds are achieved: • = 4.6 C.L. for 1 TW geo-reactor discovery
Summary and Conclusion • Current upper limit on the power on the hypothetical geo-reactor has been set at 19 TW at 90% C.L. • Simulations with larger data set show improvements but insufficient to give any final say about the existence of geo-reactor. • Destiny of the geo-reactor will be far better resolved with Hanohano detector.
Geo-reactor Pros and Cons …can explain the following unresolved question: - provide the energy source for driving the Earth’s magnetic field (0.02-10 TW of power running for more than 3 billion years!!!). - perhaps explains reversals of the geo-magnetic field (171 reversals recorded in the last 70 million years). - provide explanation for the up to 40 times higher measured ratios (comparing to average atmospheric ratio) of 3He/4He observed in volcanic plumes in Hawaii, Iceland some other places. • …requires substationally different inner core content: • Traditional Model (BSE): content of the inner core based on meteorites called carbonaceous chondrites. As a result, U and Th are in the form of oxides, act as lithophiles and can exist in the crust and mantle only. • Nuclear Earth Model (by M. Herndon): content of the inner core based on rare type of meteorites called enstatite chondrites. U and Th are alloyed with Fe or S, act as siderophiles and due to high density can exist in the inner core and particularly the Earth’s center.