Download
1 / 1
10 likes | 77 Views
A Computational Biology Approach Identifies a DIAPH3, NF -k B and NFAT5 Pathway in the Mesenchymal-Amoeboid Transition (MAT) in Prostate Cancer Sungyong You, Julie Yang, Michael R. Freeman, Jayoung Kim

E N D
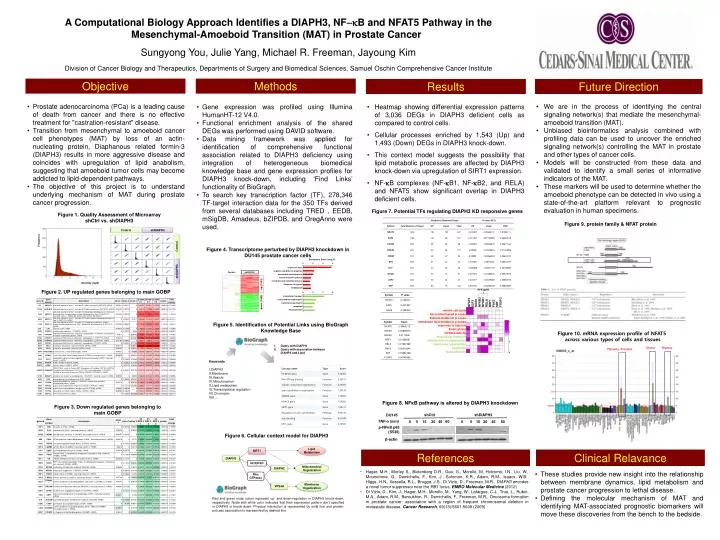
A Computational Biology Approach Identifies a DIAPH3, NF-kB and NFAT5 Pathway in the Mesenchymal-Amoeboid Transition (MAT) in Prostate Cancer Sungyong You, Julie Yang, Michael R. Freeman, Jayoung Kim Division of Cancer Biology and Therapeutics, Departments of Surgery and Biomedical Sciences, Samuel Oschin Comprehensive Cancer Institute 3 2 1 Objective Methods Results Future Direction 0 • Prostate adenocarcinoma (PCa) is a leading cause of death from cancer and there is no effective treatment for "castration-resistant" disease. • Transition from mesenchymal to amoeboid cancer cell phenotypes (MAT) by loss of an actin-nucleating protein, Diaphanous related formin-3 (DIAPH3) results in more aggressive disease and coincides with upregulation of lipid anabolism, suggesting that amoeboid tumor cells may become addicted to lipid-dependent pathways. • The objective of this project is to understand underlying mechanism of MAT during prostate cancer progression. • Gene expression was profiled using Illumina HumanHT-12 V4.0. • Functional enrichment analysis of the shared DEGs was performed using DAVID software. • Data mining framework was applied for identification of comprehensive functional association related to DIAPH3 deficiency using integration of heterogeneous biomedical knowledge base and gene expression profiles for DIAPH3 knock-down, including ‘Find Links’ functionality of BioGraph. • To search key transcription factor (TF), 278,346 TF-target interaction data for the 350 TFs derived from several databases including TRED , EEDB, mSigDB, Amadeus, bZIPDB, and OregAnno were used. • Heatmap showing differential expression patterns of 3,036 DEGs in DIAPH3 deficient cells as compared to control cells. • Cellular processes enriched by 1,543 (Up) and 1,493 (Down) DEGs in DIAPH3 knock-down. • This context model suggests the possibility that lipid metabolic processes are affected by DIAPH3 knock-down via upregulation of SIRT1 expression. • NF-kB complexes (NF-kB1, NF-kB2, and RELA) and NFAT5 show significant overlap in DIAPH3 deficient cells. • We are in the process of identifying the central signaling network(s) that mediate the mesenchymal-amoeboid transition (MAT). • Unbiased bioinformatics analysis combined with profiling data can be used to uncover the enriched signaling network(s) controlling the MAT in prostate and other types of cancer cells. • Models will be constructed from these data and validated to identify a small series of informative indicators of the MAT. • These markers will be used to determine whether the amoeboid phenotype can be detected in vivo using a state-of-the-art platform relevant to prognostic evaluation in human specimens. Figure 7. Potential TFs regulating DIAPH3 KD responsive genes Figure 1. Quality Assessment of Microarray shCtrl vs. shDIAPH3 Figure 9. protein family & NFAT protein Control shDIAPH3 Frequency Control Figure 4. Transcriptome perturbed by DIAPH3 knockdown in DU145 prostate cancer cells Enrichment Score (-log10P) mitotic cell cycle negative regulation of apoptosis microtubule-based process steroid metabolic process membrane lipid metabolic process Response to hypoxia Endocytosis shDIAPH3 Control shDIAPH3 Intensity (log2) up (1543) NFAT5 E2F3 SOX9 NFKB2 NFKB1 RELA NRF1 PAX3 SRF FOXP3 Figure 2. UP regulated genes belonging to main GOBP NF-KappaB intracellular transport mitochondrion organization membrane organization apoptosis Focal adhesion down (1493) mitotic cell cycle microtubul based process Steroid metabolic process membrane lipid metabolic process response to hypoxia Endocytosis GTPase activity intracellular transport mitochondrion organization membrane organization apoptosis focal adhesion Figure 5. Identification of Potential Links using BioGraph Knowledge Base Figure 10. mRNA expression profile of NFAT5 across various types of cells and tissues Query with DIAPH3 Query with association between DIAHP3 and Lipid Uterus Thymus Placenta, Prostate Keywords DIAPH3 Membrane Vesicle Mitochondrion Lipid metabolism Transcriptional regulation Chromatin … Figure 8. NFκB pathway is altered by DIAPH3 knockdown Figure 3. Down regulated genes belonging to main GOBP shCtrl shDIAPH3 DU145 TNF-α (min) 60 0 5 15 30 45 60 0 5 15 30 45 p-NFκB p65 (S536) Figure 6. Cellular context model for DIAPH3 β-actin Lipid Metabolism SIRT1 References Clinical Relavance DIAPH3 NCKIPSD Mitochondrial Organization DIAPH2 • Hager, M.H., Morley S., Bielenberg D.R., Gao, S., Morello, M, Holcomb, I.N., Liu, W., Mouneimne, G., Demichelis, F., Kim, J., Solomon, K.R., Adam, R.M., Isaacs, W.B., Higgs, H.N., Vessella, R.L., Brugge, J.S., Di Vizio, D., Freeman, M.R., DIAPH3 encodes a novel tumor suppressor near the RB1 locus, EMBO Molecular Medicine(2012) • Di Vizio, D., Kim, J., Hager, M.H., Morello, M., Yang, W., Lafargue, C.J., True, L., Rubin, M.A., Adam, R.M., Beroukhim, R., Demichelis, F., Freeman, M.R., Oncosome formation in prostate cancer: association with a region of frequent chromosomal deletion in metastatic disease, Cancer Research,69(13):5601-5609 (2009) • These studies provide new insight into the relationship between membrane dynamics, lipid metabolism and prostate cancer progression to lethal disease. • Defining the molecular mechanism of MAT and identifying MAT-associated prognostic biomarkers will move these discoveries from the bench to the bedside. Rho GTPases Membrane Organization VPS4A Red and green node colors represent up- and down-regulation in DIAPH3 knock-down, respectively. Node with white color indicates that their expression pattern don’t specified in DIAPH3 in knock-down. Physical interaction is represented by solid line and protein-process association is represented by dashed line