Download
1 / 16
160 likes | 258 Views
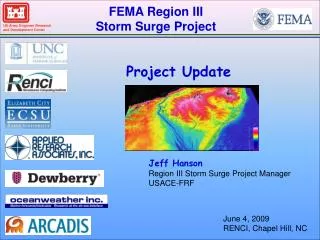
FEMA Region III Storm Surge Project. Wind and Wave Validation. Hurricane Isabel Max Wave Ht. Jeff Hanson USACE-FRF. Heidi Wadman USACE-FRF. Brian Blanton RENCI. March 9, 2011 RENCI, Chapel Hill, NC. Hurricane Ernesto August-September 2006. Cat 1, Caribbean Sea, TS Mid-Atlantic

E N D
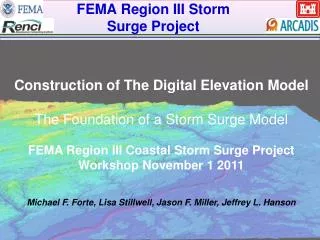
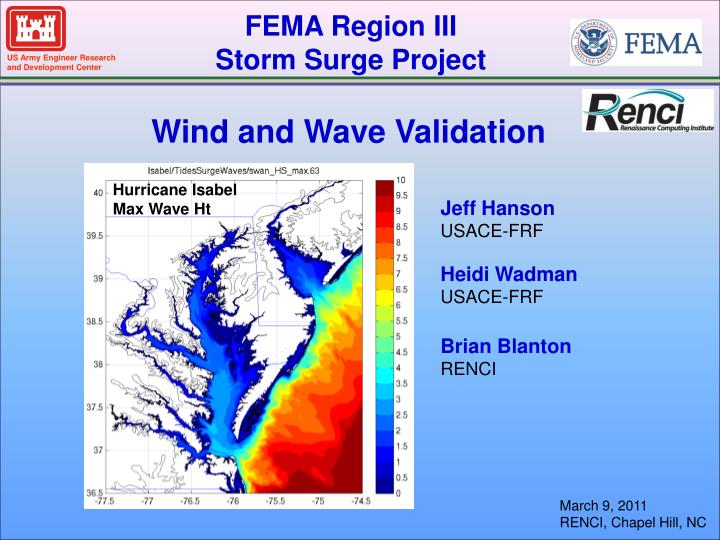
FEMA Region III Storm Surge Project Wind and Wave Validation Hurricane Isabel Max Wave Ht Jeff Hanson USACE-FRF Heidi Wadman USACE-FRF Brian Blanton RENCI March 9, 2011 RENCI, Chapel Hill, NC
Hurricane Ernesto August-September 2006 • Cat 1, Caribbean Sea, TS Mid-Atlantic • $500 million (damage); 10 fatalities • 14+” rain • 65 kt sustained winds (Caribbean Sea)
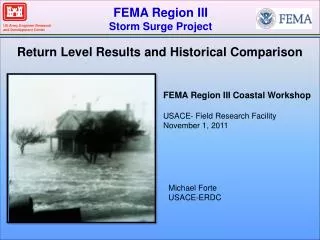
Hurricane Isabel September 2003 • Cat 5, Caribbean Sea, Cat 2 Mid-Atlantic • $3.6 billion (damages); 16 fatalities • 8-12” rain • 158 kt max sustained winds (Caribbean Sea) • 6-8’ storm surge (NC, MD)
Extra-Tropical Storm Nor’Ida November 2009 • Cat 2, “Hurricane Ida” • Nor’Ida: • $1.3 mill (damages); 1 fatality • 18+” rain (VA) • 65 mph sustained winds • 6-8’ max storm surge
Storm Surge Modeling System Atmosphere Storm Surge Waves Circulation Data Bank Performance Evaluation Model Diagnostics Model Validation Approach Regional Observations Interactive Model Evaluation and Diagnostics System
Graphical User Interface Validation Data & Storms Model Validation Wind & Wave Forcing Future Work
Features • Stand-alone desktop model validation toolkit • Based on published NOAA standards (Hess et. al., 2003; Zhang et.al., 2006). • Robust error metrics: Erms, bias, Scatter Index, Skill Score • Explore model errors as a function of time, space, event, etc. Performance Scores • Performance scores range from 0 to 1 (1 is a perfect match) • Synthesize error metrics across space and time • Normalized to mean observed quantities • A measure of error % relative to mean observed quantities
Parameters Added To-Date Winds Waves(Windsea and swell) Storm Surge Speed, Direction Height, Period, Direction Water level, High water marks Error Metrics Statistical Analyses • RMS Error • Bias, Angular bias • Scatter Index • Circular correlation • Performance (Skill) Scores • Temporal correlation • Quantile-Quantile (distributions) • Peak event (peak over threshold) Robust Error Analyses
Hurricane Isabel Wind Speeds: OWI Reconstruction vs. Observations Observation Model Peak Stats Bias (m/s) -3.3 RMS Error (m/s) 4.2 Performance 85%
Hurricane Isabel Wind Directions: OWI Reconstruction vs. Observations Observation Model Station Stats Performance 99%
Hurricane Isabel Wind Speeds: HBL vs. Observations Observation Model Peak Stats Bias (m/s) -1.8 RMS Error (m/s) 3.9 Performance 88%
Hurricane Isabel Wind Directions: HBL vs. Observations Observation Model
Hurricane Isabel Wave Heights: unSWAN vs. Observations Wave Height Errors Bias 0.49 m Erms 0.61 m SI 0.09 Maximum Height (m) 44009 Wave Height Errors Bias 0.09 m Erms 0.19 m SI 0.26 Taylors Island Wave Height Errors Bias 0.36 m Erms 0.63 m SI 0.14 44056
Hurricane Ernesto Wave Heights: unSWAN vs. Observations Wave Height Errors Bias -0.36 m Erms 0.53 m SI 0.11 Maximum Height (m) 44009 Wave Height Errors Bias -0.08 m Erms 0.40 m SI 0.14 44014
Extra Tropical Storm Ida Wave Heights: unSWAN vs. Observations Maximum Height (m) Wave Height Errors Bias 0.06 m Erms 0.47 m SI 0.12 44009 Wave Height Errors Bias 0.06 m Erms 0.43 m SI 0.34 Norfolk Wave Height Errors Bias -0.15 m Erms 0.42 m SI 0.09 44014
What’s Next – Validation Validation Goals • Final check of latest mesh – Isabel looks good • Final figures for Submittal 2 Maximum Wave Induced Force Isabel Ernesto Nor’Ida