Download
1 / 66
660 likes | 864 Views
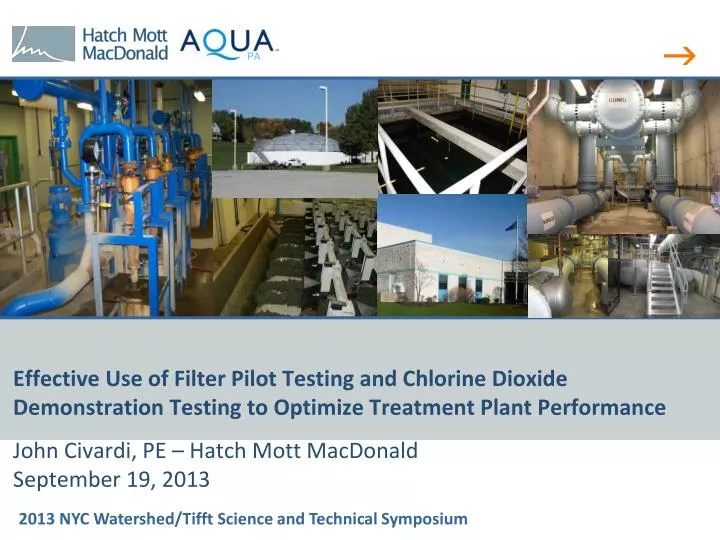
Effective Use of Filter Pilot Testing and Chlorine Dioxide Demonstration Testing to Optimize Treatment Plant Performance John Civardi, PE – Hatch Mott MacDonald September 19, 2013. Outline. Background of Aqua Shenango Water Treatment Plant Operational Issues and Treatability Study

E N D
Effective Use of Filter Pilot Testing and Chlorine Dioxide Demonstration Testing to Optimize Treatment Plant Performance John Civardi, PE – Hatch Mott MacDonald September 19, 2013
Outline • Background of Aqua Shenango Water Treatment Plant • Operational Issues and Treatability Study • UV Peroxide at Shenango • DAF Pilot Testing • Filter Testing Phases 1, 2, and 3 • Chlorine Dioxide Testing, bench and demonstration • Where We Are Now
Plant Background • Capacity 16 MGD • Raw water from the Shenango River in Sharon, PA. • Treatment: ballasted flocculation and dual media filtration, chlorine for primary disinfection and chloramines for secondary disinfection • Plant commissioned in early 2000.
Plant Schematic Soda Ash Caustic Soda Corrosion Inhibitor Ammonia Chlorine Lime PAC Pilot Area Fluoride Alum Chlorine ACTIFLO Filters Clearwell Soda Ash KMnO4 To Distribution Shenango River Raw Water Pump PAC Filter Aid Polymer Caustic Soda Chlorine
Plant Operational Issues • Disinfection By-Products • Range HAAs (53.7-97.7 ppb) • Range TTHMs (39.0-85.1 ppb) • UFRVs< 10,000 gal/sf, • Short Filter Runs • Algae • T&O Geosmin and MIB at 160 ng/L • Manganese
Water Quality Raw & Treated (Average Conditions) • Water Quality/Performance Issues (Maximum Conditions) Shown Data collected from Pilot Study from 9/15/11 to 1/23/2012
Treatability Study Options Matrix Option 1: PAC KMnO4 Replace Filter Media UV-H2O2 Clearwell River 4 MG Pre Sed Basin ACTIFLO Option 2: CLO2 Ozone Replace Filter Media UV-H2O2 Clearwell River ACTIFLO Option 3: CLO2 DAF Replace Filter Media UV-H2O2 Clearwell River ACTIFLO • Several variations were also considered
Historical T&O Treatment and Problems • Powdered Activated Carbon • Residuals Generation • PAC provided limited removal especially with Actiflo • Competitive effects of alum • Could PAC be optimized and is AOP a suitable option?
Bench Testing at Aqua’sNeshaminy WTP • Removal of up to 90% Geosmin & MIB is desired at maximum plant capacity • Aqua and Carbon Supplier performed jar tests with Geosmin to assess : • Potential competitive effects of alum on carbon usage – literature contained limited data • Optimum type of PAC • Optimum dose and detention time
PAC Testing Results • Dosing PAC together with alum results in significantly lower MIB removal (28% removal Alum/PAC vs 55% PAC then alum) • Testing found that PAC should be added prior to alum • Minimum PAC detention time is 45 minutes • Min./Max. PAC dosage is 30 mg/L - 60 mg/L
Plant Impacts of Testing • 45 Minutes of Detention Time at 15 MGD requires at 500,000 gallon pre-carbon contact tank with mixers • 30 mg/L dosage results in an additional 3,800 ppd of Dry Solids • This would double the plant solids production and require additional residuals treatment equipment
Comparison with PAC • No additional sludge handling is needed whereas the PAC process will generate approx 1.5 tons per day of dry solids (100% increase in solids production) • Ability to provide 1 log and higher removal of MIB and Geosmin • Ability to achieve additional microbial disinfection • Smaller footprint than the PAC option • Produces less than 25% CO2 compared to UV/Peroxide • Aqua Selected UV-Peroxide
UV Process Layout Shenango WTP Cooling Water Supply UV Reactor Flow Meter Chlorine Hydrogen Peroxide Cooling Water Return NC
Treatability Study to Optimize Filtration • Technical Experts • Workshops • Selected DAF, Filters, and Chlorine Dioxide • DAF minimizes residuals, low polymer use, algae performance ACTIFLO
Recommended Option Schematic Soda Ash Caustic Soda Integration of DAF into the Plant Corrosion Inhibitor Ammonia Chlorine Lime PAC Fluoride Alum Chlorine ACTIFLO Filters Clearwell Soda Ash KMnO4 To Distribution Shenango River Raw Water Pump PAC Filter Aid Polymer Caustic Soda Chlorine Pilot: Dissolved Air Flotation Pilot: Filter Optimization To Waste
Pilot Testing • Control/Baseline • Components • Coordination with Regulators • Vendors • Why Pilot Test? • Proof of Design Concept
Pilot Testing Continued • The Team • Owner: Aqua, PA Plant Staff and Main Office Water Quality, Engineering, and Laboratory in Bryn Mawr, PA • Engineer: HMM Pilot Engineer (Pittsburgh, PA), Data Review & Coordination (Millburn, NJ) • Vendors: DAF Supplier (IDI), Filter Constructor • PADEP – Protocol Approval • Cost – New Filter Columns, DAF Rental, Power, Chemicals • Data Management • Communication: Weekly Conference Calls
Pilot TestingContinued Filter Columns Backwash Controls Online Analyzers
Protocol • Three seasons: (1) High Algae (2) Cold Water (3) High Turbidity • Phase 1: Filter Optimization (9/27/11 - 10/13/11) • Phase 2: DAF and Filters at Control Steady State (10/20/11 - 11/23/11) • Phase 3: Filter Optimization for Ballast Flocculation (12/6/11 – 1/24/2012) • Phase 4: Chlorine Dioxide Addition • Control Column with Same Media as Existing Plant Filters • High Turbidity Modifications with Pre-Sedimentation Tank • Integrated Chlorine Dioxide & Sulfuric Acid
Pilot Testing Schematic pH Adjustment Polymer (if needed) Air Compressor & Saturator Sludge Scraper Coagulant To Waste Raw Water Clarified Water To Filters Flocculation Chambers DAF Tank Recycle Pump Filter Column 60 Filter Column 47 Same Configuration as Plant Filter Column 72 Filter Column GAC From ACTIFLO Sample Point To Waste
Testing Schedule Optimizing: pH, Acid & CLO2 Dosage, Flow Rates. Chlorine Dioxide Filter Optimization with Chlorinated ACTIFLO Water DAF Running at Steady State Optimize Filter
Initial Filter Testing Results Phase 1: Optimize Filter using Treated ACTIFLO Water • Column 47 Represents the Configuration of the Plant’s Filter
Initial Filter Testing Results • Phase 1 Conclusion: Filter GAC had Lower Run Times than Existing Plant Filter Configuration. • Filter 72 had the Longest Run Times Compared to All Columns • Replace Filter GAC with Filter 72 Configuration Under ACTIFLO Treated Water for Benchmark Comparison to DAF • Continue to Phase 2 2013 NYC Watershed/Tifft Science and Technical Symposium
DAF & Filter Testing Phase 2: Dissolved Air Flotation Under Steady State Conditions Column 72 is the Optimal Configuration from Phase 1 using ACTIFLO Treated Water Column 47 is the Existing Plant Configuration using DAF Treated Water • Column 47 Represents the Configuration of the Plant’s Filter
DAF & Filters During High Turbidity Events PA • Raw Water (Primary Axis) & Filter Influent (Secondary Axis) Turbidity Spike
DAF & Filters During High Turbidity Events PA • Phase 2: Effluent Turbidity with DAF Treated Water Turbidity Spike • Filter 1: 35” Anthracite • Filter 2: 48” Anthracite • Filter 3: 60” Anthracite • Filter 4: 60” Anthracite (ACTIFLO) ACTIFLO
DAF & Filters During High Turbidity Events • Phase 2: Effluent Turbidity with DAF Treated Water 47 60 72 72 Turbidity Spike ACTIFLO Date
Initial Conclusions • DAF Improved Filter Runs (UFRV) • DAF Could Not Handle High Turbidity Events and the Addition of Pre-sedimentation was not Cost Effective • Next Step – Optimize Filters for ACTIFLO
Additional Filter Testing • Phase 3: Filter Optimization with Chlorinated ACTIFLO Treated Water Under Cold Temperature Conditions • Column 47: Existing Plant’s Configuration • Column 60 & 72: Optimal Configurations from Phases 1 & 2 • Column 47 Represents the Configuration of the Plant’s Filter
Filter Data #1 Phase 3: 47 60 72 Turbidity Under Protocol Threshold Date
Filter Data #2 Phase 3: Head-Loss with ACTIFLO Treated Water Backwash Occurs when Head-Loss Reaches 120 Inches Filter’s 60 & 72 Have Longer Run Times Compared to Filter 47 (Existing Plant) 47 60 72 Date
Evaluation of Filter Data & Selection of Media * A “” indicates that the evaluation criteria goal was achieved. A “+” indicates that the filter media performed better than the existing plant’s filter media.
Evaluation of Filter Data & Selection of Media • Summary of PADEP Requirements: Effective Size, Length/Depth Ratios • Min. 12 in of Media in Effective Size Range No Greater than 0.45 to 0.55 mm • Ratio Depth (in) to Media Effective Size (mm) Greater than 40 • Anthracite Effective Size 0.8 mm to 1.2 mm, Uniformity Coefficient No Greater than 1.7 • Sand at Least 85% Siliceous Material with an Effective Size of 0.45 to 0.55 mm and a Uniformity Coefficient No Greater than 1.65 • Cost • Availability of Media
Evaluation of Filter Data & Selection of Media • Selection of Filter Media: Column 60 • Improved UFRV by 40%, Meaning Longer Filter Runs • Complies with PADEP Standards • Deeper Anthracite Layer with Larger Effective Size • Additional 2 Inches of Sand for Pathogen Barrier • Achieves Water Quality Similar to Existing Filters
Benefits of Chlorine Dioxide at the Shenango Plant • Oxidation of manganese before flocculation allows the manganese to be removed during the clarification process (ACTIFLO) and allows the chlorine dosage applied to the filter influent to be reduced or eliminated. • Reduction of the chlorine dosage at the filter influent results in reductions in DBP formation in the Shenango distribution system. • Chloramination can increase biofilm and cause nitrification in the distribution system. Chlorine dioxide normally breaks down to form chlorite ion. Studies have shown that the presence of chlorite ion in finished water results in better control of organisms in the distribution system, especially those which cause nitrification
Approach at Shenango • Bench Testing • Pilot Testing with DAF • Demonstration Testing • Procurement
ClO2 is best supplied via On-Site Generation Systems ClO2 gas is too energetic to package and ship - heat, light, pressure, shock sensitive Road transport of ClO2 gas or solutions is not allowed Bulk Shipment of CDG 3000 (0.3%) contains 6 lbs chlorine dioxide Which are then either oxidized or reduced to obtain chlorine dioxide: ClO3- chlorate ion ClO2 chlorine dioxide ClO2- chlorite ion How is CLO2 Delivered?