Download
1 / 23
240 likes | 397 Views
Graph Clustering based on Random Walk. Outline. Background Graph Clustering Random Walks MCL Basis Inflation Operator Algorithm Convergence MCL++ R-MCL MLR-MCL. Outline. Background Graph Clustering Random Walks MCL Basis Inflation Operator Algorithm Convergence MCL++ R-MCL

E N D
Outline • Background • Graph Clustering • Random Walks • MCL • Basis • Inflation Operator • Algorithm • Convergence • MCL++ • R-MCL • MLR-MCL
Outline • Background • Graph Clustering • Random Walks • MCL • Basis • Inflation Operator • Algorithm • Convergence • MCL++ • R-MCL • MLR-MCL
Graph Clustering • Clustering: group items naturally • Vector clustering Graph clustering Many links within a cluster, and fewer links between clusters Vectors are more likely to each other in the same cluster
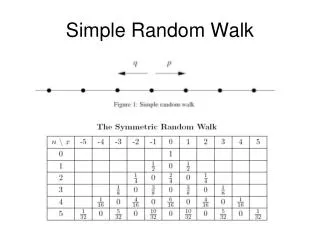
Random Walk • Observation: If you start at a node, and then randomly travel to a connected node, you’re more likely to stay within a cluster than travel between. • This is what MCL based on. • Random walk on a graph is a Markov process, that means next state only depends on current state.
Outline • Background • Graph Clustering • Random Walks • MCL • Basis • Inflation Operator • Algorithm • Convergence • MCL++ • R-MCL • MLR-MCL
Example 1 4 6 2 3 5 Transition matrix P 0 0.5 0.5 0.33 0 0 0.33 0 0.5 0 0 0 0.33 0.5 0 0 0 0 0.33 0 0 0 0.5 0.5 0 0 0 0.33 0 0.5 0 0 0 0.33 0.5 0 What’s wrong?? 0.2148 0.2148 0.2148 0.2148 0.2148 0.2148 0.1428 0.1428 0.1428 0.1428 0.1428 0.1428 0.1428 0.1428 0.1428 0.1428 0.1428 0.1428 0.2141 0.2141 0.2141 0.2141 0.2141 0.2141 0.1428 0.1428 0.1428 0.1428 0.1428 0.1428 0.1428 0.1428 0.1428 0.1428 0.1428 0.1428 P1000
What happened? 1 4 6 2 3 5 • "Flow is easier within dense regions than across sparse boundaries, however, in the long run this effect disappears." • How to deal with it? • During the walking, we should encourage the intra-cluster communications and punish the inter-ones. 0 0.5 0.5 0.33 0 0 0.33 0 0.5 0 0 0 0.33 0.5 0 0 0 0 0.33 0 0 0 0.5 0.5 0 0 0 0.33 0 0.5 0 0 0 0.33 0.5 0
MCL Inflation • MCL adjusting the transitions by columns. • For each vertex, the transition values are changed so that • Strong neighbors are further strengthened • Less popular neighbors are demoted. • This adjusting can be done by raising a single column to a non-negative power, and then re-normalizing. • This operation is named “Inflation” (the matrix powers is named “Expansion”)
Inflation example • Strengthens strong flows, and weakens already weak flows • The inflation parameter, r, controls the extent of this strengthening / weakening. This influences the granularity of clusters. Square, and then normalize
MCL Algorithm • Two processes are repeated alternately: • Expansion • Inflation
Convergence • Convergence is not proven in the thesis, however it is shown experimentally that it often does occur. • In practice, the algorithm converges nearly always to a "doubly idempotent" matrix: • It's at steady state. • Every value in a single column has the same number
Example (cont.) • How to interpret clusters?
MCL Interpreting Clusters • To interpret clusters, the vertices are split into two types. Attractors, which attract other vertices, andvertices that are being attracted by the attractors. • Attractors have at least one positive flow value within their corresponding row (in the steady state matrix). • Each attractor is attracting the vertices which have positive values within its row. • Attractors and the elements they attract are swept together into the same cluster.
Overlapping clusters • Only when a vertex is attracted exactly equally by more than one cluster • This occurs only when both clusters are isomorphic
MCL Analysis • For clusters with large diameter, MCL has problems • Distributing flow across cluster needs long expansion and low inflation (otherwise the cluster will split). • Takes many iterations and causes MCL to be sensitive to small perturbations in the graph.
MCL Analysis (cont.) • O(N3), where N is the number of vertices • N3 cost of one matrix multiplication on two matrices of dimension N. • Inflation can be done in O(N2) time • The number of steps to converge is not proven, but experimentally shown to be ~10 to 100 steps, and mostly consist of sparse matrices after the first few steps. • Speed can be improved through pruning • Inspect matrix and set small values directly to zero • Works well when the diameter of the clusters is small
Outline • Background • Graph Clustering • Random Walks • MCL • Basis • Inflation Operator • Algorithm • Convergence • MCL++ • R-MCL • MLR-MCL
References • [1] S. V. Dongen. Graph Clustering by Flow Simulation. PhD Thesis, University of Utrecht, 2000. http://igitur-archive.library.uu.nl/dissertations/1895620/inhoud.htm • [2] http://www.cs.ucsb.edu/~xyan/classes/CS595D-2009winter/MCL_Presentation2.pdf • [3] V. Satuluri and S. Parthasarathy. Scalable Graph Clustering Using Stochastic Flows: Applications to Community Discovery, KDD'09. http://portal.acm.org/citation.cfm?id=1557101 • [4] http://velblod.videolectures.net/2009/contrib/kdd09_paris/satuluri_sgcusfacd/kdd09_satuluri_sgcusfacd_01.ppt