Download
1 / 5
50 likes | 208 Views
my_seis_GUI : User-Interface grabs a waveform object defined by ‘Station’, ‘Channel’, ‘Network’, ‘Port’, ‘Host’ Start and Stop times are in form [YYYY MO DD HH MI SS] Generate a helicorder matlab figure for extracted waveform Plot events in red over raw helicorder data

E N D
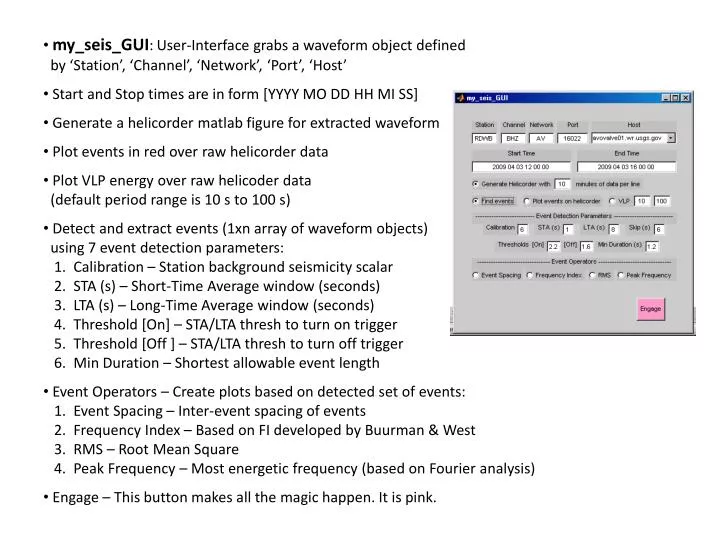
my_seis_GUI: User-Interface grabs a waveform object defined • by ‘Station’, ‘Channel’, ‘Network’, ‘Port’, ‘Host’ • Start and Stop times are in form [YYYY MO DD HH MI SS] • Generate a helicordermatlab figure for extracted waveform • Plot events in red over raw helicorder data • Plot VLP energy over raw helicoder data • (default period range is 10 s to 100 s) • Detect and extract events (1xn array of waveform objects) • using 7 event detection parameters: • 1. Calibration – Station background seismicity scalar • 2. STA (s) – Short-Time Average window (seconds) • 3. LTA (s) – Long-Time Average window (seconds) • 4. Threshold [On] – STA/LTA thresh to turn on trigger • 5. Threshold [Off ] – STA/LTA thresh to turn off trigger • 6. Min Duration – Shortest allowable event length • Event Operators – Create plots based on detected set of events: • 1. Event Spacing – Inter-event spacing of events • 2. Frequency Index – Based on FI developed by Buurman& West • 3. RMS – Root Mean Square • 4. Peak Frequency – Most energetic frequency (based on Fourier analysis) • Engage – This button makes all the magic happen. It is pink.
Helicorder: helicorder(wave,events,tra_w_m,vlp_rng) wave – waveform object (required) events – waveform array (optional) tra_w_m – trace width in minutes (required) vlp_rng – VLP range, (1x2), (optional) Shown: (event overlay mode) helicorder(wave,events,10) Event overlay creates an interactive interface with the individual events (plotted in red). Clicking on a red path will activate specific code (easily modified) within the helicorder program. The current code calls programs ‘hht_vs_fft’ and ‘event_view’. This event was clicked to generate the plots shown in slide 4.
Helicorder: Shown: (VLP overlay mode) helicorder(wave,10,[10 100]) VLP overlay plots filtered data in red over the original signal
Event View: event_view(event,frame) event – waveform object of detected event (required) frame – (1x2 double) defines amount of data before and after event to plot in event lengths. Shown: event_view(event,[1 1]) Total length of time axis is 3 times that of event event_view highlights the event with a box (shown) HHT vs FFT: hht_vs_fft(wave,nf_rng,imf_rng) wave – waveform object (required) nf_rng – Normalized Frequency Range (1x2 double), (optional) [0 1] plots from 0 Hz to the Nyquist Frequency (default) [0 .5] is shown (0 Hz to 12.5 Hz) imf_rng – IMF range (HHT plot), (1x2 integer),(optional) [1 end] plots all IMFs (default) [1 4] plots IMF 1 through IMF 4
Event Operations: Event Spacing: spacing = event_space(events,unit,op) events – Waveform object array of detected events unit – Spacing returned in (‘s’, ‘m’, ‘h’, or ‘d’) op – Operation: (‘plot’, ‘logplot’, ‘val’, ‘logval’) Frequency Index: findex = freq_index(events,lf_r,hf_r,op,tech) events – Waveform object array of detected events lf_r,hf_r – Low & High FI windows i.e. [1 2], [10 20] op – Operation: (‘plot’, ‘val’) tech – Technique: (‘fft’, ‘hht’) Event RMS: event_rms(events,op) events – Waveform object array of detected events op – Operation: (‘plot’, ‘val’) Peak Frequency: peakfreq = peak_freq(events,op,tech) events – Waveform object array of detected events op – Operation: (‘plot’, ‘val’) tech – Technique: (‘fft’, ‘hht’)


![Designing the Conversation [SmashingConf 2016]](https://cdn4.slideserve.com/7568510/designing-the-conversation-dt.jpg)