Download
1 / 50
500 likes | 633 Views
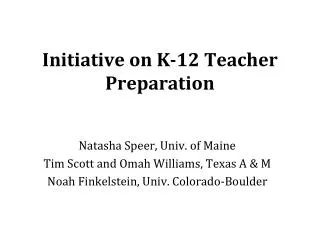
K-12 Teacher Preparation in Statistics: It is N o Longer Optional but Essential. Anna Bargagliotti, Loyola Marymount University Christine Franklin, University of Georgia Randall Groth , Salisbury University Tim Jacobbe , University of Florida Jennifer Kaplan, University of Georgia.

E N D
K-12 Teacher Preparation in Statistics: It is No Longer Optional but Essential Anna Bargagliotti, Loyola Marymount University Christine Franklin, University of Georgia Randall Groth, Salisbury University Tim Jacobbe, University of Florida Jennifer Kaplan, University of Georgia
Statistics in K-12 • The recently adopted Common Core State Standards for Mathematics (CCSSM) include a large amount of statistics content in the middle and high school grades and a smaller amount at the elementary school level • The Mathematics Education of Teachers Reports (MET 1 and MET 2) have identified statistics as a large area of concern for teacher preparation at the undergraduate level • To ensure the effective implementation of the CCSSM in the classroom, there is an immediate need to provide high quality statistical preparation of teachers during their undergraduate coursework
Teacher Preparation • In this session, we are going to discuss how teachers should be prepared in statistics • We will also provide specific examples of teacher education materials for different K-12 grade bands that exemplify best practices
Let’s get started by answering some questions with our clickers to see who we all are and what we all think about this topic
What type of department are you in? • mathematics or mathematical sciences department • statistics department • department in a college or school of education • other department
Do you teach a course for pre- or in-service teachers? • yes, a content course • yes, a methods (pedagogy) course • yes, a course that includes both content and methods • no
If you do teach teachers, what type of course for pre- or in-service teachers do you teach? • 1-semester course covering only statistics • 1-year course covering only statistics • 1-semester course in which statistics is one unit • 1-year course in which statistics is one unit
Are you familiar with the GAISE PreK-12 framework? • yes, and I use (have students read it or use the examples) it in the course I teach • yes, but I do not use it in the course I teach • yes, but I do not teach a course to pre- and in-service • a bit • no
Are you familiar with the Common Core State Standards? • yes, and I reference it in the course I teach • yes, but I do not reference it in the course I teach • yes, but I do not teach a course to pre- and in-service • a bit • no
Do you think that prospective K-5 teachers should have their own introductory statistics course, distinct from a course intended for those in other majors? a) Yes b) No c) Maybe d) Don’t know • Do you think that prospective 6-8 teachers should have their own introductory statistics course, distinct from a course intended for those in other majors? a) Yes b) No c) Maybe d) Don’t know • Do you think that prospective 9-12 teachers should have their own introductory statistics course, distinct from that intended for mathematics majors? a) Yes b) No c) Maybe d) Don’t know
Current Landscape of K-12 Teacher Prep • Our subject is in demand across all disciplines, at all age levels, and in the work force. • Teacher preparation schools and in service professional development are rapidly trying to ‘catch up’ with statistical preparation. • Must help our teachers develop a belief that they are key to the success of preparing students for our data-centric world.
Do we need change? • The prevalence of technology is demanding that teachers learn skills, practices, and ways of thinking statistically they have never encountered. • Teachers are being asked to teach in the philosophy of the Pre-K-12 GAISE Framework – most teachers do not understand the statistical investigative process or the evolution of statistical concepts
How should we change? • The Joint Position Statement from ASA-NCTM is a must read for change – provides five recommendations summarized as: • promoting well-designed PD courses and resources • cooperation between local school districts, state DOE, national organizations (i.e., ASA and NCTM) , and teacher preparation programs. http://www.nctm.org/uploadedFiles/About_NCTM/Position_Statements/1Statistics%20joint%20ASA%20NCTM%20statement%20021113.pdf
How should we change? • As a response to the Joint Position paper, ASA is supporting as an upcoming strategic initiative a team of statistics and mathematics educators, chaired by Christine Franklin and Tim Jacobbe to write a document that will provide guidance for implementing the recommendations and also as a follow up to the MET 2 recommendations in statistics. • Due out in 2014
In today’s session, we’ll look at examples of teacher statistical knowledge as well as example teaching materials from each grade band that fit the recommendations of the Joint Position Statement
K-5 Grade Band: Teacher Understanding of Nominal Categorical Data Analysis
K-5 Topic: Nominal Categorical Data Analysis • Nominal categorical data analysis can be motivated by gathering data from classmates on questions such as “What is your favorite beverage in the cafeteria?” (NCTMPrinciples and Standards, p. 110) and “What is your favorite type of music?” (GAISE K-12 Guidelines, p. 23). • Children in grades K-5 are to organize such data graphically (Common Core State Standards, K-5 Data and Measurement Strand).
Resources for developing teachers’ knowledge of teaching nominal categorical data analysis • Developing Mathematical Ideas cases (Russell, Schifter, & Bastable, 2002): Raise issues involved in leading children’s classroom discussions about nominal categorical data. • From Teaching Children Mathematics: “Statistics in the elementary grades: Exploring distributions of data” (Franklin & Mewborn, 2008) Distinguishes classroom activities and analyses suitable for categorical data from those for quantitative data. • From Mathematics Teaching in the Middle School: “It’s a fird! Can you compute a median of categorical data?” (Leavy et al., 2009) described a classroom activity based on a Connected Mathematics Projectlesson (Lappan, Fey, Fitzgerald, Friel, & Phillips, 2006) with the goal of helping students distinguish between categorical and quantitative data. It explained how the classroom teacher dealt with students’ idea that the median is suitable for nominal categorical data.
Discussion question: What kinds of difficulties might prospective teachers have in responding to children who offer these analyses of the graph shown? Discuss first with those around you, and then be ready to share with the large group.
What would you do with these pre-service teacher responses? (Groth & Bergner, in press) • “Peggy’s answer is incorrect because the graph is not in sequential order. If it was, brown would be the median since one of its points is in the middle number of data points.” • “Priscilla is correct. You can only find the mean or average of this data set because it is categorical. I would support her learning by sharing exactly what the average represents and allow her to think about what it means, and why it is a good representer of this data set.”
What would you do with these pre-service teacher responses? (Groth & Bergner, in press) • “Gray is not the median color because of its location on the graph. The colors are displayed in alphabetical order, which still does not make gray the median. This data is categorical, not quantitative, meaning there is no real reason for the order and there is no median.” • “Jordydid not arrange the data in a logical order because she just took the top number from each bar graph. The correct way would be to write out ‘blue’ 7 times, ‘brown’ 8 times, ‘gray’ 4 times, etc. and then find the median.”
6-8 Grade Band: Variability in Data and Distributions & Comparing Distributions
NCTM’s Essential Understanding Series • Gary Kader & Tim Jacobbe • Developing essential understanding of statistics for teaching mathematics in grades 6-8. • Roxy Peck, Rob Gould, & Stephen Miller • Developing essential understanding of statistics for teaching mathematics in grades 9-12. • Spring 2013/Available Now!
Big Ideas for Grades 6-8: Statistics is a Problem Solving Process • Variability in Data and Distributions • Comparing Distributions • Association between two variables • Samples and populations
Big Idea 2: Comparing Distributions • How do the fizz times for two brands of effervescent tablets compare? • 25 Fizz Times for each of two brands of effervescent tablets/Parallel Dotplots
For which set of Fizz Times (Real versus Hypothetical) is the difference between Medians more meaningful? • CCSSM suggests that the magnitude of a difference between two centers can be assessed by "expressing it as a multiple of a measure of variability."
When is a difference meaningful? • When comparing two medians, the larger the quantity the more meaningful the difference between the two medians is. Note: Use the larger IQR
When is a difference meaningful? • When comparing two means, the larger the quantity the more meaningful the difference between the two means is. Note: Use the larger MAD
Meaningful Differences • For the real fizz time data, we will use the larger IQR for Brand B (22) as the divisor here. • Real Data: = .73 Hypothetical Data: = .44 • Thus, the difference between medians is more meaningful for the real data than for the hypothetical data. This illustrates why variability in data is of utmost importance in statistics.
Summary/Conclusion • Statistics as a problem solving process • The role of variability • Changing what students experience • Changing the preparation of teachers to teach statistics • Essential Understandings will hopefully help
Bivariate Data • Data that has two variables • Typically, we want to explore the relationship between the two variables • Our goal is to get teachers to think about how to approach bivariate data analysis without providing them with a step-by-step formulaic list • We want teachers to: • Be able to identify the appropriate analysis procedures given the data and driving question at hand • Be able to carry out the analysis procedures • Our approach today is to show you a hands on sample activity to prepare high school teachers to teach bivariate data analysis
Example: Height, Jumps & Sports • Ms. K’s class is interested in exploring the relationship between a person’s height and his/her ability to jump vertically as well as the relationship between their gender and whether they like sports. To do this, the class decides to measure the height and vertical jump ability of each student in the class using a specific test procedure. The procedure consists of taping measuring tapes to the wall and measuring the height of a person as well as how high they jump. To reduce measurement variation and increase accuracy, the same person will measure all the vertical jumps. Additionally, each student will jump 3 times and their biggest jump of the three will be recorded. • After completing the jump measurement, each student is asked to record their gender and answer the question: “Do you like to play sports?” • Here are the data collected in one class.
Two-Way Tables and Bar Charts • Summarize the responses of student’s gender and whether the student likes sports in a two-way frequency table • Using the frequency table, answer the following: • Is there evidence in this class sample of a positive association between liking gender and liking sports? Justify your answer by pointing out a feature of the table that supports it • Can Height and Vertical Jump be summarized in a two-way frequency table? Explain why or why not.
Bivariate Data Analysis: Categorical Variables There appears to be an association between gender and liking sports. For example, ¾ of the males like sports while ½ of the females report liking sports • Because height and jump height are continuous variables, they can be displayed in a scatter plot • As continuous variables the height and jump height cannot be summarized in a two-way table • However, these data may be summarized in a two-way table if new variables are defined that group the data into categories (i.e., construct categorical variables from the continuous variables)
Bivariate Quantitative Variables • Looking at the scatter plot for Height and Vertical Jump, does there appear to be a pattern? If so, describe it. • Would you consider the pattern to be strong, moderate, or weak? • Sketch what you consider to be the “line of best fit” for the data. Find the approximate equation of this line without using a computer. • When you drew the “line of best fit”, how did you decide to draw the line? • Why don’t all the data points lie on the line of best fit?
Interpretation • The equation of the least-squares line for these data is: • Est Vertical Jump = -40.76 + 0.84*Height • What is the meaning of the slope of the linein the context of this problem?
Summary/Conclusions • There are different approaches to bivariate data analysis depending on whether your variables are categorical or quantitative • We want teachers to recognize the appropriate analysis approaches • Make pictures! • We want teachers to make pictures (tables, scatter plots) before doing numerical analyses • There are differences between statistical models and deterministic models • We want teachers to point out the differences since they will most likely be teaching bivariate data analysis along with linear functions
Conclusions • There is lots of work to be done in teacher prep at all grade levels to address the needs of the CCSS-M and GAISE • Today we have provided examples of teacher’s needs and thoughts as well as examples of lessons to be used with teachers • Here is a list of resources and references related to K-12 teacher prep
Thank you! • Contact Information: • Anna Bargagliotti: abargagl@lmu.edu • Christine Franklin: chris@stat.uga.edu • Randall Groth: REGROTH@salisbury.edu • Tim Jacobbe: jacobbe@coe.ufl.edu • Jennifer Kaplan: jkaplan@uga.edu
Do you think that prospective K-5 teachers should have their own introductory statistics course, distinct from a course intended for those in other majors? a) Yes b) No c) Maybe d) Don’t know • Do you think that prospective 6-8 teachers should have their own introductory statistics course, distinct from a course intended for those in other majors? a) Yes b) No c) Maybe d) Don’t know • Do you think that prospective 9-12 teachers should have their own introductory statistics course, distinct from that intended for mathematics majors? a) Yes b) No c) Maybe d) Don’t know