Download
1 / 20
200 likes | 319 Views
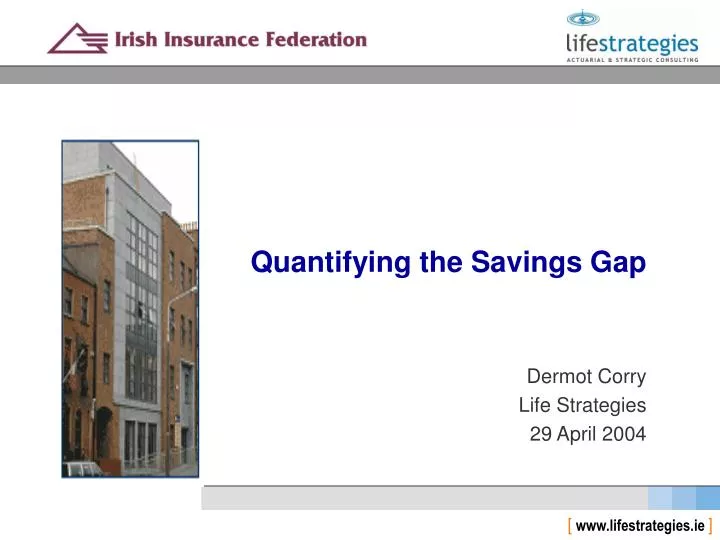
Quantifying the Savings Gap. Dermot Corry Life Strategies 29 April 2004. Life Strategies. Actuarial & Strategic Consultancy Headquartered in Dublin Offices in the UK and Italy Focus is the Financial Services Industry Clients are mainly financial services companies Client list includes:

E N D
Quantifying the Savings Gap Dermot Corry Life Strategies 29 April 2004 [ www.lifestrategies.ie ]
Life Strategies • Actuarial & Strategic Consultancy • Headquartered in Dublin • Offices in the UK and Italy • Focus is the Financial Services Industry • Clients are mainly financial services companies • Client list includes: • Allianz • Aviva • Citigroup • Societe Generale • San Paolo IMI • And many more domestic and international companies
Agenda • Background and objectives • Methodology and assumptions • Savings shortfall • Impact of assumption changes • Sample case studies • Conclusions
Background • There is an increasing pension problem in Ireland and elsewhere • Only 50% of the Labour Force have a pension • Even those with pensions often have an income shortfall at retirement • The IIF invited proposals to calculate the savings shortfall in Ireland • Savings shortfall is “the additional savings per annum required to deliver adequate income in retirement”
Objectives • Calculate the savings shortfall • Test the impact of assumption changes • Produce high level conclusions • The focus is the individual • We take no account of a shortfall in funding the state pension or any defined benefit schemes
Methodology Overview • All data adjusted to 2003 values • Labour Force aged 20-64 – 1.78m people • These were divided into 25 segments based on income and age
Methodology (continued) • For each segment we calculated: • Current earned income • Required income in retirement • State Pension in Retirement • Defined Benefit Pensions • Value of Current Assets at Retirement (incl DC) • Value of Current Savings at Retirement (incl DC) • Shortfall in capital at retirement • Corresponding savings shortfall per annum • Sub segments created for those with DB pensions • Segments combined to give overall shortfall • Detailed methodology available in our detailed report We placed capital values on each of these in Retirement
Key Assumptions • Price inflation 2.25% • Earnings inflation 3.25% (1% above price inflation) • Additional career progression 1% for each year up to earnings age 50 • Investment return 4.5% (2.25% real) • Mortality Population mortality with future improvements • Retirement age 65 • State pension Increases Earnings inflation • Increases in required income Price inflation post retirement • SSIAs Assume 25% continue to be saved for retirement
Results • Total earned income of this group is €55bn • Required retirement income is €35.7bn. (65% Average) • In crude terms: • State pension provides 45% of requirement (€16.1bn) • Defined benefit pensions provide 15% (€5.4bn) • Savings, Investments and DC pensions provide 10% (€3.6bn) • Therefore there is a shortfall of 30% (€10.7bn p.a.) • This income shortfall converts to a savings shortfall of €6.0bn per annum
Breakdown of €6.0bn • Breakdown given below in €m per annum shortfall
Alternative Presentations • So we could summarise the average shortfall as 11% of income or €3,300 per person per annum
Some Comments on the Shortfall • Averages by nature disguise differences – substantial differences apply within segments • Lowest income group has a low shortfall • State pension provides a high level of replacement • Income shortage is the real problem • Highest income group has a relatively low shortfall as a group • Some people in this category still will have large shortfalls • Those with Defined Benefit pension plans or good DC schemes are generally close to fully provided • Middle income groups have the biggest problem • €2,500 to €5,000 per annum shortfall • About 13% of income • These groups represent 71% of the population
Impact of Assumption Changes • The shortfall is sensitive to some of the key assumptions • Impact on the shortfall of some of the more significant items: • Increase State pension at price inflation +48% • Increase post-retirement income at earnings +45% • Reduce target retirement age to 60 +193% • Reduce target retirement age to 63 +40% • Increase target retirement age to 70 -58% • Assume 2% higher investment return -20% • Allow for equity in owner occupied property -22% • Clearly there is a lot of variability. We are happy with our chosen assumptions for a central figure
Sample Case Study 1 • Paul, aged 45, €30,000 income, no assets or savings, DB pension scheme, €10,000 non mortgage loan outstanding • Calculations work as follows • Required income p.a. €20,700 (69% of income) • State pension p.a. (€8,208) (2003 figures) • Defined benefit pension p.a. (€8,904) (30 years service) €3,588 • Capital Value at retirement €66,666 • Add repayment of loan €29,178 • Total Shortfall at retirement €95,844 • Savings shortfall per annum €2,444 (8.1% of income)
Sample Case Study 2 • Ann, aged 35, €35,000 income, €28,000 assets and €2,200 savings p.a. incl. SSIA, No pension scheme • Calculations work as follows • Required income p.a. €22,400 (64% of income) • State pension p.a. (€8,208) (2003 figures) €14,192 • Capital Value at retirement €762,559 • Assets and savings at retirement (€170,710) • Net Shortfall at retirement €591,849 • Savings shortfall per annum €6,731 (19.2% of income)
Sample Case Study 3 • John, aged 45 with dependant spouse. €60,000 income, €107,000 assets and €9,000 savings p.a. incl. SSIA and DC pension scheme paying 10% • Calculations work as follows • Required income p.a. €29,400 (49% of income) • State pension p.a. (€14,548) (2003 figures) €14,852 • Capital Value at retirement €605,453 • Assets and savings at retirement (€451,879) • Net Shortfall at retirement €153,574 • Savings shortfall per annum €3,916 (6.5% of income)
Sample Case Study 4 • Jane, aged 35, €75,000 income, €282,000 assets and €5,000 savings p.a. incl. Investment Property and SSIA. No pension • Calculations work as follows • Required income p.a. €36,750 (49% of income) • State pension p.a. (€8,208) (2003 figures) €28,542 • Capital Value at retirement €1,523,333 • Assets and savings at retirement (€869,102) • Net Shortfall at retirement €654,231 • Savings shortfall per annum €7,441 (9.9% of income)
Recap • Savings Shortfall is €6.0bn per annum • This is the equivalent to 11% of income • Alternatively, equivalent to an average of €3,300 per person per annum • These are the additional savings needed per annum to deliver the required income in retirement • Substantial variations for individuals depending on circumstances
Conclusions • Something is needed to address the core middle income groups – a pension version of the SSIA? • An active equity release market could make a substantial difference (30% release reduces shortfall by 22%) • Shortfall is very sensitive to retirement age – allow greater flexibility around retirement • Information is crucial to decision making. How many people are aware of their shortfall? Improve information from current plans
Thank you for your attention Summary Report will be available in your pack Detailed report is available on the web – www.lifestrategies.ie Contact Details – dermot.corry@lifestrat.ie or 01-6475900