Download
1 / 2
20 likes | 25 Views
Tableau is a powerful and fastest growing data visualization tool used in the Business Intelligence Industry. It helps in simplifying raw data into the very easily understandable format.NetTech India is the software training institute in Thane and Mumbai which offer best Tableau certification course for students in lower price.We provide best Tableau training to students. The course designed by Net Tech will help you to clear the Tableau Desktop 10 Qualified Associate exam and will help you begin a new assignment with confidence.For more details please call us on 9870803004/5. <br>

E N D
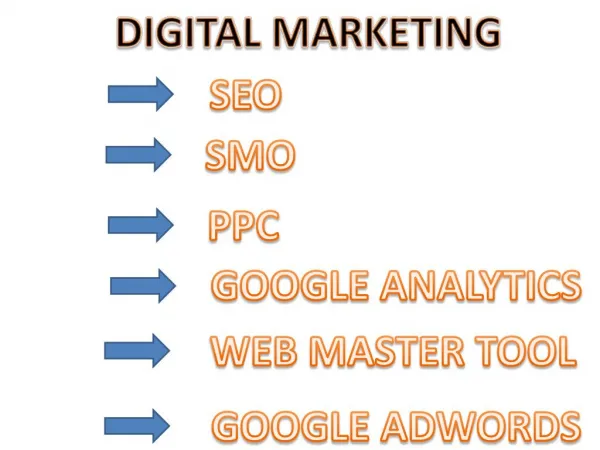
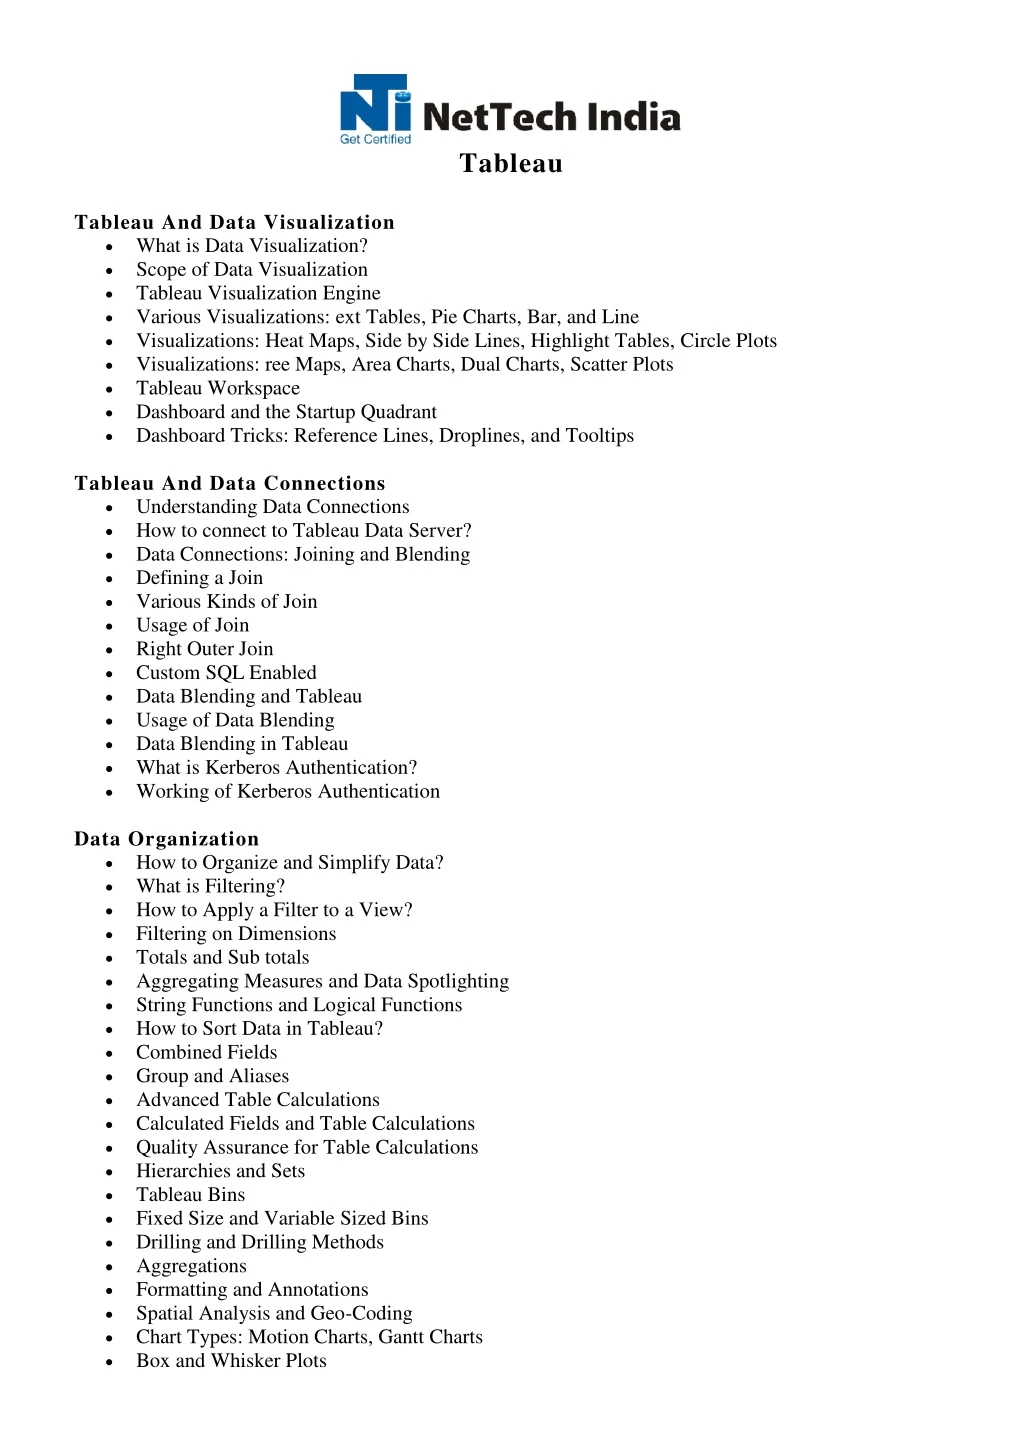
Tableau Tableau And Data Visualization What is Data Visualization? Scope of Data Visualization Tableau Visualization Engine Various Visualizations: ext Tables, Pie Charts, Bar, and Line Visualizations: Heat Maps, Side by Side Lines, Highlight Tables, Circle Plots Visualizations: ree Maps, Area Charts, Dual Charts, Scatter Plots Tableau Workspace Dashboard and the Startup Quadrant Dashboard Tricks: Reference Lines, Droplines, and Tooltips Tableau And Data Connections Understanding Data Connections How to connect to Tableau Data Server? Data Connections: Joining and Blending Defining a Join Various Kinds of Join Usage of Join Right Outer Join Custom SQL Enabled Data Blending and Tableau Usage of Data Blending Data Blending in Tableau What is Kerberos Authentication? Working of Kerberos Authentication Data Organization How to Organize and Simplify Data? What is Filtering? How to Apply a Filter to a View? Filtering on Dimensions Totals and Sub totals Aggregating Measures and Data Spotlighting String Functions and Logical Functions How to Sort Data in Tableau? Combined Fields Group and Aliases Advanced Table Calculations Calculated Fields and Table Calculations Quality Assurance for Table Calculations Hierarchies and Sets Tableau Bins Fixed Size and Variable Sized Bins Drilling and Drilling Methods Aggregations Formatting and Annotations Spatial Analysis and Geo-Coding Chart Types: Motion Charts, Gantt Charts Box and Whisker Plots
Mapping and Locations Pan Zoom Lasso and Radial Selection Advanced Data Preparation And Analytics In Tableau Studying Retail Sector Forecasting Building and Analyzing Box Plots How to work with Large Data Sources in Tableau? Understanding and Implementing Pivot and Split Real World Retail and its Data Data Source Filters Trendlines Advanced Timeseries Blending Calculating Sales Per Capita Forecasting in Tableau How to Present a Storyline? Creating Animations in Tableau Real World Case Study: World Health Trends Investigation Building Visualization and Adding Animation Manually Sorting Blended Data Finalizing the Dashboard and Animations in Tableau Dashboards And Work Sharing Building Interactive Dashboards What are Action Filters? How to create Story Boards? Best Practices to create Dashboards Cover Pages Annotations Tool Tips and keyboard shortcuts Sharing work Tableau Online Tableau Reader 203/RATNMANI BLDG, DADA PATIL WADI, OPP ICICI ATM, THANE WEST Web: www.nettechindia.com Phone : 9870803004/ 9870803005