Download
1 / 81
810 likes | 1.1k Views
ALBUQUERQUE AND BERNALILLO COUNTY ZIP CODE MAPS HEALTH AND SOCIAL INDICATORS Office of Community Assessment, Planning and Evaluation Public Health District 1, New Mexico Department of Health July 2004. ALBUQUERQUE AND BERNALILLO COUNTY ZIP CODE MAPS HEALTH AND SOCIAL INDICATORS

E N D
ALBUQUERQUE AND BERNALILLO COUNTY ZIP CODE MAPS HEALTH AND SOCIAL INDICATORS Office of Community Assessment, Planning and Evaluation Public Health District 1, New Mexico Department of Health July 2004
NMDOH, Public Health District 1, Office of Community Assessment, Planning and Evaluation
ALBUQUERQUE AND BERNALILLO COUNTY ZIP CODE MAPS HEALTH AND SOCIAL INDICATORS Version 6 - July 2004 Sarah Khanlian & Tom Scharmen Office of Community Assessment, Planning and Evaluation District 1, Public Health Division, New Mexico Department of Health
NMDOH, Public Health District 1, Office of Community Assessment, Planning and Evaluation
Albuquerque / Bernalillo County - Health and Social Indicator Maps What good is this book? This series of maps is intended to assist community and agency groups in Albuquerque to interpret and understand problems in our communities. The maps can be ‘cut and pasted’* directly into other documents, with attribution. Please feel free to send this collection to colleagues who might find it useful. The maps illustrate rates, averages and percentages of demographic, socio-economic and health indicators distributed across the 18 city zip codes. They can be used to write grant proposals, evaluate projects, make presentations to the public or elected representatives, and - in general – take informed actions based on the problems and strengths of our communities. This is version 6 (July 28, 2004) of the map book. New data have been added and some old data have been corrected – if you have a previous version of this collection, you should now delete it. The map book now contains 37 maps, each with an accompanying data table. In the tables, you will find the numbers that correspond to the mapped values plus other values not included on the maps. The tables also provide values for city quadrants (NE, NW, SE, SW), two zip codes in rural Bernalillo County (87008 and 87059), and sums of all listed zip codes or entire county. Please note that the zip codes listed on the tables do not include zip codes that overlap other counties. A printed version of this collection will soon be available. You may also request an MSExcel version of all the tables. See contact information below. This project will continue in the future. Suggestions for new indicators to be mapped are welcome, as well as requests for special assistance. Especially appreciated from you - the user - are stories about how this book has been useful, suggestions on how to improve it, and your comments on how the data it contains should be interpreted. Thank you, Thomas N. Scharmen, M.A., M.P.H., Epidemiologist New Mexico Department of Health, District I, Public Health Division North Valley Public Health Office 7704-A 2nd St, NW Albuquerque, NM 87107 Telephone: 897-5700 ext 126 E-mail: toms@doh.state.nm.us *See instructions for ‘cutting and pasting’ on the following page
NMDOH, Public Health District 1, Office of Community Assessment, Planning and Evaluation
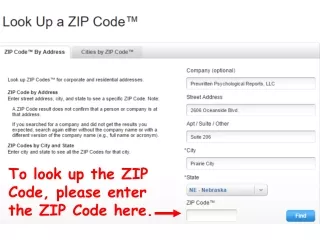
HOW TO TRANSFER A MAP INTO A WORD DOCUMENT • To save a slide in a metafile or GIF format: • Display the slide you want to save as a picture and select it by clicking anywhere on the map. • On the File menu, click Save As. • In the Save as type box, click Windows Metafile or GIF Graphics Interchange Format. • Choose a folder in which to save the file. • To Insert the picture you have saved into your Word document: • Open the Word document • Click to place the cursor where you want to insert the picture. • On the Insert menu, point to Picture, and then click From File. • Locate the folder and the picture you want to insert. • Double-click the picture you want to insert. • Note: the title of the map may disappear in the Word document: just change the size of the document with the % function, or use the Page Up and Page Down keys, and it will re-appear. The map will print with the complete title even though it may not be visible on your screen. • HOW TO TRANSFER A TABLE INTO A WORD DOCUMENT • Display the slide with the table you want to transfer. • Click anywhere on the table. • Click File and then Copy. • Open the Word document. • Click where you want to insert the table. • Click File and then Paste. • Note: The tables cannot be modified, however, you may request an MSExcel version of all the tables. See contact information on previous page. NMDOH, Public Health District 1, Office of Community Assessment, Planning and Evaluation
NMDOH, Public Health District 1, Office of Community Assessment, Planning and Evaluation
ALBUQUERQUE, NM Population under 15 Data Source: US Census 2000 NMDOH, Public Health District 1, Office of Community Assessment, Planning and Evaluation
NMDOH, Public Health District 1, Office of Community Assessment, Planning and Evaluation
ALBUQUERQUE, NM Population 65 & Over Data Source: US Census 2000 NMDOH, Public Health District 1, Office of Community Assessment, Planning and Evaluation
NMDOH, Public Health District 1, Office of Community Assessment, Planning and Evaluation
ALBUQUERQUE, NM Latino or Hispanic Population Data Source: US Census 2000 NMDOH, Public Health District 1, Office of Community Assessment, Planning and Evaluation
NMDOH, Public Health District 1, Office of Community Assessment, Planning and Evaluation
ALBUQUERQUE, NM Population American Indian and Alaska Native Data Source: US Census 2000 NMDOH, Public Health District 1, Office of Community Assessment, Planning and Evaluation
NMDOH, Public Health District 1, Office of Community Assessment, Planning and Evaluation
ALBUQUERQUE, NM Unemployment Rate Data Source: US Census 2000 NMDOH, Public Health District 1, Office of Community Assessment, Planning and Evaluation
NMDOH, Public Health District 1, Office of Community Assessment, Planning and Evaluation
ALBUQUERQUE, NM Percent of Persons Below 100% of Federal Poverty Level Data Source: US Census 2000 NMDOH, Public Health District 1, Office of Community Assessment, Planning and Evaluation
NMDOH, Public Health District 1, Office of Community Assessment, Planning and Evaluation
ALBUQUERQUE, NM Single-Parent Familiesas a % of All Families with Children Data Source: US Census 2000 NMDOH, Public Health District 1, Office of Community Assessment, Planning and Evaluation
NMDOH, Public Health District 1, Office of Community Assessment, Planning and Evaluation
ALBUQUERQUE, NM Families under 185% of the Federal Poverty Level Data Source: US Census 2000 NMDOH, Public Health District 1, Office of Community Assessment, Planning and Evaluation
NMDOH, Public Health District 1, Office of Community Assessment, Planning and Evaluation
ALBUQUERQUE, NM Single Mother Families under 185% of Federal Poverty Level Data Source: US Census 2000 NMDOH, Public Health District 1, Office of Community Assessment, Planning and Evaluation
NMDOH, Public Health District 1, Office of Community Assessment, Planning and Evaluation
ALBUQUERQUE, NM Income Disparity Income of Richest 20% Divided by Income of Poorest 20% Source: NM Tax & Revenue Department, 1998 NMDOH, Public Health District 1, Office of Community Assessment, Planning and Evaluation
NMDOH, Public Health District 1, Office of Community Assessment, Planning and Evaluation
ALBUQUERQUE, NM Population Over 17 yrsWho Speak Only Spanish at Home Data Source: US Census 2000 NMDOH, Public Health District 1, Office of Community Assessment, Planning and Evaluation
NMDOH, Public Health District 1, Office of Community Assessment, Planning and Evaluation
ALBUQUERQUE, NM Population Foreign Born and not US Citizen Data Source: US Census 2000 NMDOH, Public Health District 1, Office of Community Assessment, Planning and Evaluation
NMDOH, Public Health District 1, Office of Community Assessment, Planning and Evaluation
ALBUQUERQUE, NM 5 to 17 Year-Olds NOT Enrolled in School Data Source: US Census 2000 NMDOH, Public Health District 1, Office of Community Assessment, Planning and Evaluation
NMDOH, Public Health District 1, Office of Community Assessment, Planning and Evaluation
ALBUQUERQUE, NM Persons 25 Years or Older Who Have Not Completed High School Data Source: US Census 2000 NMDOH, Public Health District 1, Office of Community Assessment, Planning and Evaluation
NMDOH, Public Health District 1, Office of Community Assessment, Planning and Evaluation
ALBUQUERQUE, NM Middle School TerraNova Scores 7th Graders Combined Data Source: Albuquerque Public Schools NMDOH, Public Health District 1, Office of Community Assessment, Planning and Evaluation
NMDOH, Public Health District 1, Office of Community Assessment, Planning and Evaluation
ALBUQUERQUE, NM Free & Reduced Lunch Rate APS Middle School Data Source: Albuquerque Public Schools NMDOH, Public Health District 1, Office of Community Assessment, Planning and Evaluation
NMDOH, Public Health District 1, Office of Community Assessment, Planning and Evaluation
ALBUQUERQUE, NM Vacant Housing Data Source: US Census 2000 NMDOH, Public Health District 1, Office of Community Assessment, Planning and Evaluation
NMDOH, Public Health District 1, Office of Community Assessment, Planning and Evaluation
ALBUQUERQUE, NM Renter Occupied Housing Data Source: US Census 2000 NMDOH, Public Health District 1, Office of Community Assessment, Planning and Evaluation
NMDOH, Public Health District 1, Office of Community Assessment, Planning and Evaluation
ALBUQUERQUE, NM Mean Annual Fertility Rate Women 15 to 19, 1996 to 2000 Data Source: NMDOH, Vital Records and Health Statistics NMDOH, Public Health District 1, Office of Community Assessment, Planning and Evaluation
NMDOH, Public Health District 1, Office of Community Assessment, Planning and Evaluation
ALBUQUERQUE, NM Mean Annual Fertility Rate Women 20 to 44, 1996 to 2000 Data Source: NMDOH, Vital Records and Health Statistics NMDOH, Public Health District 1, Office of Community Assessment, Planning and Evaluation
NMDOH, Public Health District 1, Office of Community Assessment, Planning and Evaluation
ALBUQUERQUE, NM Low Birth Weight Births Women 15 to 19 Mean Annual %,1996 to 2000 Data Source: NMDOH, Vital Records and Health Statistics NMDOH, Public Health District 1, Office of Community Assessment, Planning and Evaluation
NMDOH, Public Health District 1, Office of Community Assessment, Planning and Evaluation