Download
1 / 17
170 likes | 176 Views
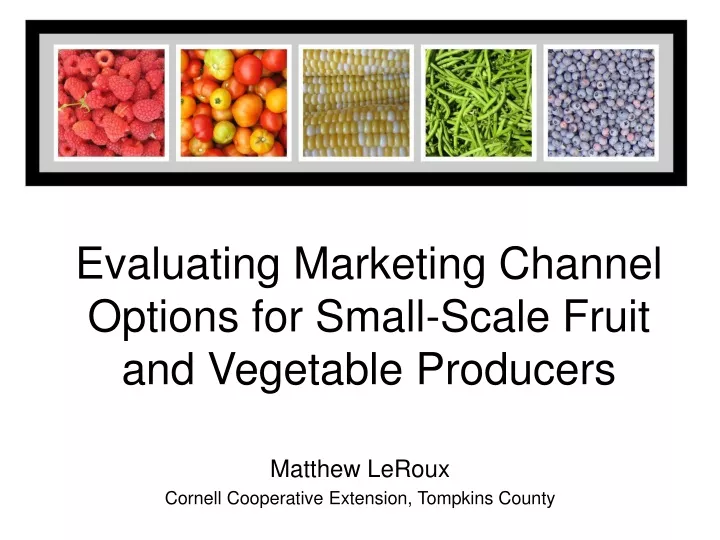
Evaluating Marketing Channel Options for Small-Scale Fruit and Vegetable Producers. Matthew LeRoux Cornell Cooperative Extension, Tompkins County. Opportunity is knocking…. CSA. Farmers’ Market. U-Pick. Restaurant. Grocery. Distributor. Farm Stand.

E N D
Evaluating Marketing Channel Options for Small-Scale Fruit and Vegetable Producers Matthew LeRoux Cornell Cooperative Extension, Tompkins County
Opportunity is knocking… CSA Farmers’ Market U-Pick Restaurant Grocery Distributor Farm Stand
But, it costs $300 per day to sell there. Joe, if you bring your vegetables to the farmers’ market the prices are so high you can sell $500 worth per hour! That’s great. I am going to sell there. …and its only 1 hour per week... …and it takes 12 hours to prepare... …and if it rains no customers come.
Price & Profit You can sell $500 worth per hour! It costs $300/day to sell there. Associated Costs …and its only 1 hour per week... Sales Volume …and it takes 12 hours to prepare... Labor Requirements …and if it rains no customers come. Risk How do you evaluate a market opportunity? Six interacting factors impact the “performance” of a marketing channel including: Lifestyle Preferences
Methodology I • Case studies of four farms: • 18-20 acres in production, diverse fruit and vegetable, in operation for at least 5 years. • The farms represent participation in 3 wholesale and 4 direct marketing channels. Direct Marketing Channels Wholesale Marketing Channels Farmers’ Market: 3 farms CSA: 2 farms Farm Stand: 1 farm U-pick: 1 farm Restaurant: 2 farms Grocery: 3 farms Distributor: 2 farms
Why labor logs? • Labor the largest marketing expense. • Consistent unit and format. • Operators tell hired help to complete the forms. • Each employee filled out their own sheets. Methodology II • Collected logs of all marketing labor (from harvest to sale) for one typical, peak season week. • Collected channel specific mileage and gross sales by channel for the same week.
Labor logs JOE 7/24 2.5 hrs kale Wegmans
Methodology III • Used group totals & averages for channel comparisons and ranking by: • Profit (gross sales - (labor cost + mileage) • Labor hours needed • Sales volume • Also used data from a survey (n=14) to rank the channels for risk.
VOLUME PRICE Sales Volume by Channel
#5 #4 #3 #2 #1 #2 #1 #3 Profit Four Farm Average Profit as % of Gross Sales with Owner Labor Valued Versus Not Valued
Channel Combination with prioritized selling maximizes sales of unpredictable perishable crop yields.
Summary • Identify your goals and lifestyle preferences. • Keep marketing cost & returns records, if only for “snapshot” periods. • Value your own time to present an accurate picture of marketing costs. • Rank and compare opportunities to maximize profits. • Combine channels to max sales and reduce risks.
Practical Application • Farmers said “do it for us”. • An evaluation tool has been developed. • Any farmer can complete one week of labor logs and we will analyze them. • Benefit to the producer, a “soil test” for their marketing efforts. Informed decisions may result in increased profits and decrease in labor needs.