Download
1 / 9
90 likes | 95 Views
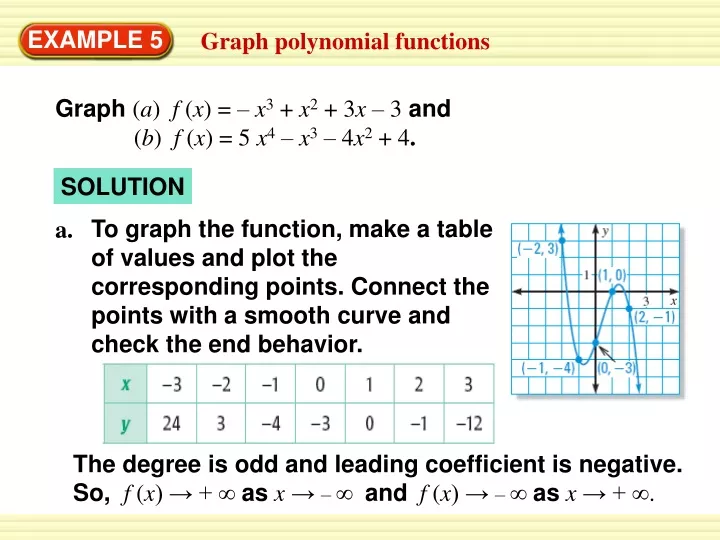
To graph the function, make a table of values and plot the corresponding points. Connect the points with a smooth curve and check the end behavior. a. EXAMPLE 5. Graph polynomial functions.

E N D
To graph the function, make a table of values and plot the corresponding points. Connect the points with a smooth curve and check the end behavior. a. EXAMPLE 5 Graph polynomial functions Graph (a)f (x) = – x3 + x2 + 3x – 3 and (b)f (x) = 5 x4 – x3 – 4x2 + 4. SOLUTION The degree is odd and leading coefficient is negative. So, f (x) → + ∞ asx → –∞ andf (x) → –∞ asx → + ∞.
b. To graph the function, make a table of values and plot the corresponding points. Connect the points with a smooth curve and check the end behavior. EXAMPLE 5 Graph polynomial functions The degree is even and leading coefficient is positive. So, f (x) → ∞asx → –∞and f (x) → ∞asx → + ∞.
Physical Science The energy E (in foot-pounds) in each square foot of a wave is given by the model E = 0.0029s4 where sis the wind speed (in knots). Graph the model. Use the graph to estimate the wind speed needed to generate a wave with 1000 foot-pounds of energy per square foot. EXAMPLE 6 Solve a multi-step problem
Make a table of values. The model only deals with positive values of s. EXAMPLE 6 Solve a multi-step problem SOLUTION STEP 1
STEP 2 Plot the points and connect them with a smooth curve. Because the leading coefficient is positive and the degree is even, the graph rises to the right. STEP 3 Examine the graph to see that s 24 when E = 1000. The wind speed needed to generate the wave is about 24 knots. ANSWER EXAMPLE 6 Solve a multi-step problem
Graph the polynomial function. 9. f (x) = x4 + 6x2– 3 x – 2 –1 0 1 2 y 374 –3 4 37 for Examples 5 and 6 GUIDED PRACTICE SOLUTION To graph the function, make a table of values and plot the corresponding points. Connect the points with a smooth curve and check the end behavior.
x – 3 –2 –1 0 1 2 y 409 0 –1.7 –3 2 for Examples 5 and 6 GUIDED PRACTICE 10.f (x) = 2x3 + x2 + x – 1 SOLUTION To graph the function, make a table of values and plot the corresponding points. Connect the points with a smooth curve and check the end behavior.
To graph the function, make a table of values and plot the corresponding points. Connect the points with a smooth curve and check the end behavior. a. x – 2 –1 0 1 2 y 206 4 –12 2 for Examples 5 and 6 GUIDED PRACTICE 11. f (x) = 4 – 2x3 SOLUTION
12. WHAT IF? If wind speed is measured in miles per hour, the model in Example 6 becomes E = 0.0051s4. Graph this model. What wind speed is needed to generate a wave with 2000 foot-pounds of energy per square foot? ANSWER about 25 mi/h. for Examples 5 and 6 GUIDED PRACTICE