Download
1 / 13
130 likes | 134 Views
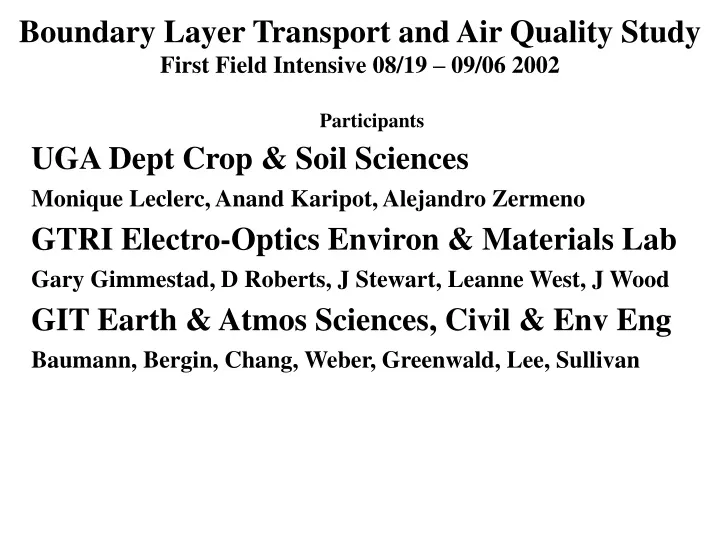
Boundary Layer Transport and Air Quality Study First Field Intensive 08/19 – 09/06 2002. Participants UGA Dept Crop & Soil Sciences Monique Leclerc, Anand Karipot, Alejandro Zermeno GTRI Electro-Optics Environ & Materials Lab Gary Gimmestad, D Roberts, J Stewart, Leanne West, J Wood

E N D
Boundary Layer Transport and Air Quality StudyFirst Field Intensive 08/19 – 09/06 2002 Participants UGA Dept Crop & Soil Sciences Monique Leclerc, Anand Karipot, Alejandro Zermeno GTRI Electro-Optics Environ & Materials Lab Gary Gimmestad, D Roberts, J Stewart, Leanne West, J Wood GIT Earth & Atmos Sciences, Civil & Env Eng Baumann, Bergin, Chang, Weber, Greenwald, Lee, Sullivan
GIT’s Mobile Air Quality Lab Aquire 1 Hz QA/QC 1 min Report 30 min
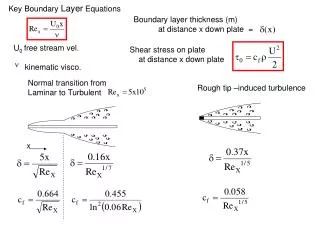
UGA BL Turbulence Measurements A) Mini-PA2 BL Sodar: vertical range 1050m, resolution 10m/20m, time-averaged statistics every 30 min plus raw data collected continuously. Credible flow velocities include mean wind speed (u, v,w) and the variances of each of the components. B)Sonic anemometer/thermometer: 10Hz; 30 min averages and raw data of u, v, w; parameters to be calculated: Monin-Obukhov length, friction velocity, the three velocity variances and the virtual temperature information (mean and variances), heat flux. C) Tethered Balloon:cup wind speed, wind direction, temperature, humidity, ozone. Low frequency sensors only, no turbulence information.
Fine Particulate Matter (PM2.5), Wind Direction, and Ozone at various GA locations, 08/20 – 09/15 2002
Ambient Pressure, Temperature and Water Vapor at the GA FAQS locations, 08/20 – 09/15 2002
Fine Particulate Matter (PM2.5), Wind Direction, and Ozone at various GA locations, 09/03 – 09/13 2002
Ambient Pressure, Temperature and Water Vapor at the GA FAQS locations, 09/03 – 09/13 2002
Ambient Meteorological Conditions at the Griffin FAQS site, 09/03 – 09/13 2002 Balloon Launches
PM2.5 and Trace Gas Concentrations at the Griffin FAQS site, 09/03 – 09/13 2002 Balloon Launches
PM2.5 and Trace Gas Concentrationsat the Griffin FAQS site, 09/03 – 09/06 2002 Balloon Launches
Ambient Meteorological Conditionsat the Griffin FAQS site, 09/03 – 09/06 2002
Fine Particulate Matter (PM2.5), Wind Direction, Speed, and Ozoneat various GA locations, 09/03 – 09/06 2002