Download
1 / 168
1.72k likes | 1.81k Views
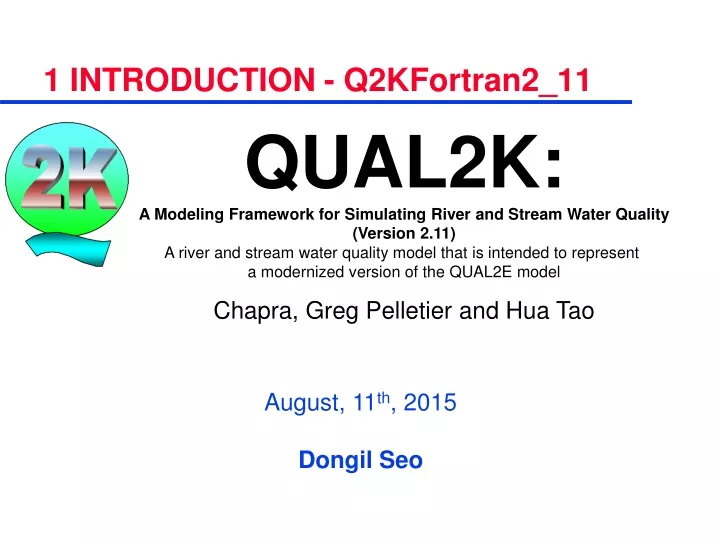
1 INTRODUCTION - Q2KFortran2_11. QUAL2K: A Modeling Framework for Simulating River and Stream Water Quality (Version 2.11) A river and stream water quality model that is intended to represent a modernized version of the QUAL2E model Chapra, Greg Pelletier and Hua Tao. August, 11 th , 2015

E N D
1 INTRODUCTION - Q2KFortran2_11 QUAL2K: A Modeling Framework for Simulating River and Stream Water Quality (Version 2.11) A river and stream water quality model that is intended to represent a modernized version of the QUAL2E model Chapra, Greg Pelletier and Hua Tao August, 11th, 2015 Dongil Seo
QUAL2K PHYSICS “If the physics isn’t correct, you don’t have a prayer of getting the water quality right!” • Segmentation • Flow Balance • Depth, Velocity and Travel Time • Dispersion • Temperature Modeling - Slide by S. Chapra
QUAL2K Segmentation Scheme • The model represents a river as a series of reaches • These represent stretches of river that have constant hydraulic characteristics • (e.g., slope, bottom width, etc.). • The reaches are numbered • in ascending order starting • from the headwater of the river’s main stem.
Elements Reach n = 4 REACHES AND ELEMENTS The model’s fundamental computational unit which consists of an equal length subdivision of a reach. done by specifying the number of elements that are desired A length of river with constant hydraulic characteristics If desired, any model reach can be further subdivided into a series of n equal-length elements
Headwater boundary 1 Point source 2 Point abstraction 3 4 Point source 5 Non - point abstraction 6 Non - point 7 source Point source 8 Downstream boundary SEGMENTATION - Slide by S. Chapra
QUAL2K segmentation scheme and headwater and tributary numbering schemes For systems with tributaries the reaches are numbered in ascending order starting at reach 1 at the headwater of the main stem.
3.1 Flow Balance • A steady-state flow balance is implemented for each model reach • Qi = Qi-1 + Qin,i – Qab,I • Total Inflow • Total Outflow
E B G A C F D Upstream Lake QB QC QD QE QF QG QA STEADY-STATE FLOW BALANCE - Slide by S. Chapra
The water velocity and depth increase WHAT HAPPENS WHEN YOU ADDFLOW TO A SLOPING CHANNEL? Given Qoutflow, compute depth (H) and velocity (U): • Weir • Rating Curves • Continuity and Manning equation - Slide by S. Chapra
RATING CURVES MANNING EQUATION 3.2 Hydraulic Characteristics • Once the outflow for each reach is computed, • the depth and velocity are calculated • 1) If a weir height is entered, • the weir option is implemented. • 2) If the weir height and width are zero • and rating curve coefficients • are entered (a and a), • the rating curve option is implemented. • 3) If neither of the previous conditions are met, • Q2K uses the Manning equation WEIR
Hh WEIRS (a) Side (b) Cross-section Bw Hh Hd Hi Hi Hw Hw Hi+1 elev2i elev2i elev1i+1 elev1i+1 • Height of water in reach upstream of weir • Drop of water between reaches - Slide by S. Chapra
B i B H i H h H w • For a sharp-crested weir where Hh/Hw< 0.4, flow is related to head by (Finnemore and Franzini 2002) • where Qiis the outflow from the segment upstream • of the weir in m3/s, and Biand Hhare in m. • Equation (4) can be solved for (4)
Hd elev2i elev1i+1 DROP OF WATER BETWEEN REACHESSEPARATED BY A WEIR (For reaeration) • This result can then be used to compute the depth of reach i, and the drop over the weir • and Hi Hi+1 - Slide by S. Chapra
Rating Curves • Power equations can be used to relate mean velocity and depth to flow, • where a, b, α and β are empirical coefficients • that are determined from • velocity-discharge and • stage-discharge rating curves, respectively.
= 0.0279 U Q 0.5652 (m) H Rating Curves = 1.6487 H Q 0.1622 1 10 (m/s) U 3 (m /s) Q (m /s) 3 Q 0.1 1 500 500 100 100 - Slide by S. Chapra
H = aQib U = aQib Qi = Ac U Ac = B H Ratng Curve Computation Qi - Slide by S. Chapra
H =aQb U = aQb a = U; b = 0 a = H; b = 0 1 1 U = UQ0 H = HQ0 CONSTANT DEPTH AND VELOCITY - Slide by S. Chapra
The values of velocity and depth can then be employed to determine the cross-sectional area and width by • The exponents b and β typically take on values listed in Table 1. • Note that the sum of b and β must be less than or equal to 1. • If their sum equals 1, the channel is rectangular.
Table 1 Typical values for the exponents of rating curves used to determine velocity and depth from flow (Barnwell et al. 1989).
3.2.3 Manning Equation • Each reach is idealized as a trapezoidal channel • Given Q, uses Manning Equation to compute H, and U where Q = flow [m3/s], S0 = bottom slope [m/m], n = the Manning roughness coefficient, Ac=the cross-sectional area [m2], and P = the wetted perimeter [m].
The cross-sectional area of a trapezoidal channel is computed as • where B0 = bottom width [m], • ss1 and ss2 = the two side slopes [m/m], and H = reach depth [m]. • The wetted perimeter is computed as • Notice that time is measured in seconds in this and other formulas used to characterize hydraulics within Q2K. • However, once the hydraulic characteristics are determined they are converted to day units to be compatible with other computations.
Hk+1 can be iteratively solved as • where k = 0, 1, 2, …, n, where n = the number of iterations. • The method is terminated when the estimated error falls below a specified value of 0.001%.
2 / 5 æ ö 3 / 5 2 2 + + + + ç ( Qn ) B H s 1 H s 1 [ ] è 0 s 1 s 2 ø = + + A B 0 . 5 ( s s ) H H = H 0 1 2 c s s [ ] 3 / 10 + + S B 0 . 5 ( s s ) H 0 s 1 s 2 Q = U A c Manning Approach - Slide by S. Chapra
The estimated error is calculated as • Velocity can be determined from the continuity equation with the cross-sectional area • The average reach width, B [m], can be computed as
Manning roughness coefficient for various open channel surfaces (from Chow et al. 1988) • Manning’s n typically varies with flow and depth • As the depthdecreases at low flow, • The relative roughness increases.
Typical published values of Manning’s n, • range from about 0.015 for smooth channels • to about 0.15 for rough natural channels, • when the flow is at the bankfull capacity • Criticalconditions of depth for evaluating water quality are • generally much less than bankfull depth, and • the relative roughness may be much higher.
Q Weir Rating Curves Manning U, H Ac = Q/U B = Ac /H As = Dx B V = B H Dx tw = Dx / U = V/Q RIVER HYDROGEOMETRY (STEADY) - Slide by S. Chapra
3.2.4 Waterfalls • The drop of water over a weir • to compute the enhanced reaeration • that occurs in such cases. • In addition to weirs, • such drops can also occur at waterfalls • QUAL2K computes such drops for cases where • the elevation above sea level drops abruptly • at the boundary between two reaches.
Hi Hd elev2i Hi+1 elev1i+1 • For both the rating curve and the Manning equation options • Hd= elev2i + Hi - elev1i+1 – Hi+1 • The drop is only calculated for • elev2i > elev1i+1.
3.3 Travel Time • The residence time of each reach is computed as • where tk= the residence time of the kth reach [d] • Vk= the volume of the kth reach [m3] = Ack∆xk • and ∆xk= the length of the kth reach [m] • The travel time from the headwater to the downstream end of reach i, • where tt,i = the travel time [d]
3.4 Longitudinal Dispersion • 1) the user can simply enter estimated values. • 2) if the user does not enter values, • internally compute dispersion based on the channel’s hydraulics (Fischer et al., 1979) • Ep,i= the longitudinal dispersion between reaches i and i +1 [m2/s], • Ui= velocity [m/s], Bi= width [m], • Hi= mean depth [m], and Ui* = shear velocity [m/s], • g = acceleration due to gravity [= 9.81 m/s2] and • S = channel slope [dimensionless].
E = 0 E = moderate E = high DISPERSION - Slide by S. Chapra
2 é ù nU = S ê ú 2 / 3 ê ( / ) ú A P ë û c IF YOU DO NOT ENTER A SLOPE • If the user has entered a roughness coefficient, Manning’s equation is used to estimate the slope • If the user has neither entered a slope nor a roughness coefficient, E = 0 - Slide by S. Chapra
The bulk dispersion coefficient • The bulk dispersion coefficient is computed as • Note that a zero dispersion condition is applied at the downstream boundary. • The net heat load from sources is computed as • Tps,i,j = the jth point source temperature for reach i [oC] • Tnps,i,j = the jth non-point source temperature for reach i [oC].
4 TEMPERATURE MODEL • A heat balance can be written for reach i as • Ti = temperature in reach i [oC], t = time [d], • E’i = the bulk dispersion coefficient between reaches i and i + 1 [m3/d], • Wh,i = the net heat load from point and non-point sources into reach I [cal/d], • ρw = the density of water [g/cm3], • Cpw = the specific heat of water [cal/(g oC)], • Jh,i = the air-water heat flux [cal/(cm2 d)], and • Js,i = the sediment-water heat flux [cal/(cm2 d)].
atmospheric transfer sediment-water transfer sediment Q2K HEAT BALANCE heat load heat abstraction inflow outflow i dispersion dispersion - Slide by S. Chapra
COFFEE MASS BALANCE HEAT BALANCE extensive sugar mass heat sweetness intensive concentration temperature H T = M V lumps cup c = relationship V r Cp TEMPERATURE MODELINGANALOGY BETWEEN MASS AND HEAT - Slide by S. Chapra
Shortwave radiation (visible light) • Shortwave radiation is basically radiant energy (light). • contains a lot of energy) • ultraviolet (UV) rays, • visible light • or Infra Red • Some of shortwave radiation • which enters the Earth • is reflected to space • due to reflection, • with the others being absorbed • by the surface or other things
longwave radiation (infrared light) • Longwave radiation is energy leaving the Earth as infrared energy. • Earth emits a large amount of longwave energy, only around 5% is directly lost to space, • with the majority being absorbed by greenhouse gases and being converted to heat energy which is then emitted as atmospheric longwave radiation, resulting in the greenhouse effect. • The atmospheric longwave radiation emission is split into 2 categories with 40% being lost to space, and the other 60% being transmitted to the Earth’s surface where it is absorbed and becomes heat energy.
For cloudy conditions • the atmospheric emissivity may increase • as a result of increased water vapor content. • High cirrus clouds (권운, 卷雲) • may have a negligible effect • Lower stratus clouds (층운, 層雲) and • Cumulus clouds (적운, 積雲) • may have a significant effect.
4.1 Surface Heat Flux • Surface heat exchange is modeled as a combination of five processes: • I(0) = net solar shortwave radiation at the water surface, • Jan = net atmospheric longwave radiation, • Jbr = longwave back radiation from the water, • Jc = conduction, and Je = evaporation [cal/cm2/d]
Summer Solstice (하지) 2000 1500 Equinox (춘분, 추분) 1000 Winter Solstice (동지) 500 0 0 6 12 18 24 DAILY SOLAR RADIATION - Slide by S. Chapra
Cloud Attenuation • Attenuation of solar radiation due to cloud cover is computed with • where CL = fraction of the sky covered with clouds.
Reflectivity • A and B are coefficients related to cloud cover • Coefficients used to calculate reflectivity based on cloud cover
Shade • the fraction of potential solar radiation that is blocked by topography and vegetation - Slide by S. Chapra
4.1.1 Solar Radiation • The model computes the amount of solar radiation entering the water at a particular latitude (Lat) and longitude (Llm) on the earth’s surface. • A function of the radiation at the top of the earth’s atmosphere • attenuated by atmospheric transmission, cloud cover, shade, and reflection • I(0) = Io at ac (1-Rs) (1 – Sf) • where I(0) = solar radiation at the water surface [cal/cm2/d], • I0 = extraterrestrial radiation (i.e., at the top of the earth’s atmosphere) • at = atmospheric attenuation, • CL = fraction of sky covered with clouds, • Rs = albedo (fraction reflected; 반사계수), • Sf = effective shade (fraction blocked by vegetation and topography). Extraterrestrial radiation Atmospheric Attenuation Cloud Attenuation Reflection Shading
Air Temperature Solar Shortwave radiation Dew Point Temperature ( ) = + s + + - 4 J J ( T 273 Atmospheric longwave radiation . 15 ) A 0 . 031 e ( 1 R ) sn air air L - es + - - - - 4 conduction evaporation ( T 273 . 15 ) c f ( U )( T T ) f ( U )( e e ) Water longwave radiation s 1 w s air w s air Solar (Cloud Cover) Wind Speed WHAT YOU NEED???(METEOROLOGICAL DATA) - Slide by S. Chapra
Ti Ts,i 4.2 Sediment-Water Heat Transfer • A heat balance for bottom sediment underlying a water reach i can be written as • Ts,i = the temperature of the bottom sediment below reach i [℃] • ρs= the density of the sediments [g/cm3] • Cps = the specific heat of the sediments [cal/(g ℃)] • Jh,i= the air-water heat flux [cal/(cm2 d)] • Js,i = the sediment-water heat flux [cal/(cm2 d)] • Hsed,i= the effective thickness of the sediment layer [cm]
The flux from the sediments to the water can be computed as • as = the sediment thermal diffusivity [cm2/s] • Presence of solid material in stream sediments leads • to a higher coefficient of thermal diffusivity • than that for water or porous lake sediments. • In Q2K, a value of 0.005 cm2/s used