Download
1 / 30
300 likes | 419 Views
Chilean Infrastructure Industry Overview. Fernando Zavala. November, 2006. 1. Brief Overview of the Chilean Toll Roads Industry. Introduction. The urban toll road infrastructure business in Chile has been extremely active

E N D
Chilean Infrastructure Industry Overview Fernando Zavala November, 2006
1 • Brief Overview of the Chilean Toll Roads Industry
Introduction • The urban toll road infrastructure business in Chile has been extremely active • Project Financing and the formation of consortiums were critical aspects during the first phase of the industry • Original investors/sponsors are looking for options to monetize the capital gains originated from investments • Groups specialised in toll roads operation becoming increasingly interested in the sector. • Specialised investment funds monitoring the evolution of the sector – difficulties to exit investments in the short term • Costanera Norte is the first successful M&A transaction where the original investors exit the company, and a global toll road operator enters into the country. • ABN AMRO has been a leader in this industry in Chile since its origins
10,000 8.0% 5.6% 4.9% 6.2% 6.3% 8,000 6.0% 6,000 3.9% 3.4% 3.7% 2.2% 4.0% 3.0% 2.9% 4,000 2.8% 2.6% 2.4% 2,000 2.0% 1.1% 0 0.0% 01 02 03 04 05 06F 07 F 01 02 03 04 05 06F 07 F GDP per Capita Real GDP growth Chile Macro Overview – High growth combined with moderate risk • Excellent economic performance • Investment grade status since 1992 • Average 6% real GDP growth over the last 20 years • Well controlled inflation-targeting regime averaging a 4.1% inflation rate over the last 10 years • Chile is the most stable, most transparent and best performing economy in Latin America Key Facts • Positive macroeconomic outlook • Strong real GDP growth forecasted for 2006 (4.9%) and 2007 (5.6%) • Stable inflation forecasts for 2006 (2.9%) and 2007 (3.0%) GDP PC (US$) and real GDP growth Inflation (CPI y-o-y changes)
Argentina 286 Brazil 218 Chile 81 Colombia 172 Mexico 111 Peru 142 0 50 100 150 200 250 300 Chile Macro Overview – High growth combined with moderate risk • Key pillars of the model: Key Facts • Balanced public accounts • Independent Central Bank • Solid financial system • Stable & transparent politics • Open and developed local capital markets • Strong and diversified mix of exports; increasing imports following GDP per capita growth • Free Trade Agreements: EU, USA, Korea, Canada and Mexico. Presently negotiating with China and India, among other Sovereign Risk (EMBI)
Dams Public Penitentiaries 2% Edification 3% 2% Public Transportation 1% Urban Highways 27% Interurban Highways 61% Airports 4% Concessions Awarded to Private Sector in Chile Total awarded volume of business over US$ 6.3 Billion 48 Projects Awarded to Private Companies Total Concession Investments • 20 Highways: US$3,805M • 10 Airports: US$272M • 9 Urban Projects • 7 Highways: US$1,722M • 2 Public Transportation (Intermodal Stations): US$50M • 3 Prison Infrastructure Programs (8 prison precincts): US$205M • 2 Dam: US$140M • 4 Public Edification: US$114M Source: MOP
Other road infrastructure Road projects under infrastructure evaluation projects 24% 45% Penitentiaries, Railroads & others 9% Dams 11% Airports Hospitals 8% 3% Concession Projects 2006 - 2008 35 Projects to be awarded totaling more than US$ 3.6 Billion in investments Project Portfolio 2006 - 2008 Expected Concession Investments • Road infrastructure projects (10): US$1,621M • Hospitals (3): US$300M • Airports (4): US$100M • Dam (2): US$390M • Penitentiaries projects (2), Railroads (1) & Others (2): US$344 M • Other road infrastructure projects under study (11): US$884M Source: MOP
Toll Road Concession Operators in Chile URBAN TOLL ROADS Ownership • There will be players either divesting non-core investments or partially monetizing / recycling equity investments. Anillo El Salto-Kennedy 50% Autopista Central 48% Vespucio Norte 46% Vespucio Sur 50% Radial nor-Oriente 100% Vespucio Norte 45% Anillo El Salto-Kennedy 50% Vespucio Sur 50% Costanera Norte 100% Autopista Central 48%
Toll Road Concession Operators in Chile INTERURBAN TOLL ROADS Ownership • There will be players either divesting non-core investments or partially monetizing / recycling equity investments. Los Libertadores 100% Autopista del Sol 100% Los Andes 100% Rutas del Pacifico 50% Elqui 72% Los Lagos 88% Litoral Central 50% Rutas del Pacifico 50% 100% Nogales Puchuncavi Talca Chillan 76% Autopista del Maipo 100% Ruta de los Ríos 76% Ruta de la Araucanía 100% 50% Litoral Central Autopista del Itata 100% Autopista del Aconcagua 100% Autopista del Bosque 100% Melipilla 100%
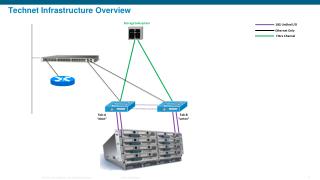
Central Chile – Metropolitan Region Concession Highways Autopista Valle Chacabuco (Radial Nor-Oriente) Vespucio Norte • ACS 46%, Hochtief 45%, Cofide 8% • 29 Km highway • 30-yr concession • Sacyr • 21.5 km highway • 40-yr concession San Cristobal Express (Anillo El Salto-Kennedy) Autopista Central • ACS 48%, Skanska 48%, Belfi 2%, Brotec 2% • 60.5 km highway • 30-yr concession • Hochtief 50%, ACS 50% • Urban tunnel • 30-yr concession Costanera Norte Vespucio Sur • Autostrade 50%, SIAS 50% • 42.3 km highway • 30-yr concession Vespucio Sur • Acciona 50%, Sacyr 50% • 23.5 Km highway • 30-yr concession Source: MOP, Coordinación General de Concesiones
Central Chile (Excluding Metropolitan Region) Concession Highways Nogales-Puchuncavi • Delta • 27 Km toll road • 22-yr concession Rutas del Pacifico (Ruta 68) • ACS 50%, Sacyr 50% • 137.5 Km highway • 25-yr concession Autopista de Los Andes Puchuncavi Nogales • OHL • 113 Km highway • 20-yr concession Los Andes Viña del Mar Valparaiso Litoral Central Autopista Los Libertadores • Sacyr 50%, Acciona 50% • 79.8 Km toll road • 30-yr concession Quintay • OHL • 88.65 Km toll road • 28-yr concession Casablanca Santiago San Antonio Melipilla Autopista del Sol • Besalco • 8 Km toll road • 25-yr concession • OHL • 102 Km highway • 23.7-yr concession Embalse Rapel San Pedro Source: MOP, Coordinación General de Concesiones
Regional Interurban Concession Highways Autopista del Aconcagua Concesiones del Elqui • Bancomext • Sacyr Chile S.A. 75%, Abertis 25% Tunel El Melón Autopista del Maipo • Endesa Chile • Cintra Talca Chillán • Cintra 76.43%, Inversiones Sodeia Cinco S.A. 23.57% Camino de la Madera • Belfi S.A. 33.9%, Las Américas A.F.I. S.A. 33.9%, CMB Prime A.F.I. S.A. 26.5% Autopista del Itata • Bancomext Ruta de la Araucanía Autopista del Bosque • Cintra • Vinci Los Lagos Ruta de los Ríos • Sacyr 88.1%, Empresa Nacional de Autopistas 11.9% • Cintra 75%, Las Américas A.F.I. S.A. 25%
Stages of Sector Development Background Today… Stage 1 – “Construction” Stage 2 – “Operation” Stage 3 – “Consolidation” • Toll road concessions awarded • Construction period risks: • Expropriation • Completion • Cost overrun • Licensing delays • Project financing • Negotiation of complementary agreements with MOP • New projects contemplating MDI • Second generation projects + PPIs • Pure constructors start seeking exit alternatives • “Construction / operation” players review portfolio alternatives • Concession operators and infrastructure funds looking for M&A transactions • Operation period risks: • Traffic • Price & inflation • O&M cost overruns • Technology • Billing & collection • Political & regulatory • New complementary agreements (extensions, improvements) • Trend towards concentration in fewer large operators holding a portfolio of motorway concessions • Once scale is achieved: • M&As (consolidation / monetization) • IPOs (partial monetization)
2 • Costanera Norte & Transelec Case Studies
Sociedad Sociedad Concesionaria Concesionaria Costanera Norte S.A. Costanera Norte S.A. USD USD 277,100,000 277,100,000 Sale of 100% of Costanera Sale of 100% of Costanera Norte to Autostrade SpA Norte to Autostrade SpA and Sias SpA and Sias SpA Sole Financial Adviser to Sole Financial Adviser to Impregilo SpA Impregilo SpA Chile, June 2006 Chile, June 2006 Recent M&A Transaction: Costanera Norte Case Study - Chile • ABN AMRO advised Impregilo SpA in the sale of Sociedad Concesionaria Costanera Norte S.A. For an EV of USD 625 million • Deal closed in June 2006. • ABN AMRO acted as sole financial advisor to Impregilo SpA, TECSA and Fe Grande. • ABN AMRO executed this complex project leading to a successful closing in June 2006. • Costanera Norte’s deal is the largest M&A transaction in Chile in the new concession road industry up to date,
Recent M&A Transaction: Costanera Norte Case Study - Chile • ABN AMRO executed the whole M&A process performing several tasks that included, among others: • Valuation: using DCF, Trading and Transaction methods • Preparation of investment teaser • Selection and contact with potential strategic and financial investors in Chile and globally • Development of the Information Memorandum for the transaction • Negotiation of Confidentiality Agreements with short-listed potential bidders • Guidance to Bidders to presenting a Non-Binding Offer • Selection of investors for the final phase of the process • Negotiation with group of short listed potential buyers • Coordination of Management Presentations and Visits to the facilities • Guidance of Bidders through preparation and presentation of Binding Offers • Preparation of Bid Analysis reports to facilitate client decision making process • Assistance in preparation of Sale & Purchase Agreement in conjunction with the legal advisors • Preparation and coordination of the Due Diligence process • Advisory assistance through Closing
Transaction multiples Transaction multiples Transaction multiples Transaction multiples EV / EBITDA P/E P/E 2005 2005 2006E 2006E Transaction Transaction 12.6x 12.6x 12.2x 12.2x 24.7 24.7 multiple multiple ABN ABN AMRO's 10.5x 10.5x 10.2x 10.2x 18.3 18.3 estimates estimates Overview of Transelec Transaction Key Considerations • Transelec is a regulated transmission business that owns high voltage lines • On June 16, 2006 Brookfield Asset Management and its partners agreed to acquire 92% of Transelec for $1.55 bn plus the assumption of debt • The consortium acquired the remaining 8% of Transelec in a separate transaction from IFC • ABN AMRO believed that that most bidders would have been comfortable paying up to 10.5x EBITDA. This led to an IRR of approximately 11-13%. • In our view, the bid for Transelec is an outlier and led to an ROE below 10%. • Other bidders for Hydro-Quebec’s stake were: GE/First Reserve, Abengoa, ISA, Canadian pension funds (Ontario Teachers’ Pension Fund, Borealis), Terna, Celfin (Chilean investors)
3 • Brief Overview Infrastructure M&A worldwide
Overview of Infrastructure related transactions worldwide Infrastructure M&A transactions volume 1998 - 2006 YTD Infrastructure deals peaked at US $ 145 Bln in 2006 reflecting increasing investor appetite for investments capable of generating stable returns in the long term US$ Bln 160 140 120 100 80 60 40 20 0 1998 1999 2000 2001 2002 2003 2004 2005 2006 Source: ABN AMRO
Overview of Infrastructure related transactions worldwide Largest Infrastructure M&A transactions 1998 - 2006 YTD Deal Value Date Target Acquirer (US Bln) Feb 8 2006 BAA (UK) Ferrovial (Spain) 30.2 Apr 23 2006 Autostrade (Italy) Abertis Infrastructuras (Spain) 28.4 May 29 2006 Kinder Morgan (US) Private equity consortium (US) 27.5 Jan 18 2000 Coastal (US) El Paso Energy (US) 15.7 Feb 27 2006 KeySpan (US) National Grid (UK) 11.9 Jun 27 2002 Railtrack (UK) Network Rail (UK) 11.5 Oct 2 2006 AWG (UK) Osprey Acquisitions (Canada) 10.3 Source: Thomson Financial Private equity funds showed increasing involvement in infrastructure related transactions, accounting for more than 50% of deal volumes in 2006 (comparing positively with the 2 % involvement recorded in 1998)
EV/EBITDA Company name Mkt Cap EV (EURm, 11/7/'06) 2005 2006 2007 2008 AUTOSTRADE 12,789 22,446 12.1x 11.5x 10.8x 10.1x Autoroute du Sud de la France 11,503 19,325 12.3x 11.5x 10.9x 10.2x Abertis 10,489 14,793 12.7x 7.1x 6.7x 6.4x Macquarie Infrastructure Group 8,243 10,942 9.6x 10.0x 12.2x 11.3x APPR 6,059 11,170 11.5x 10.7x 10.2x 9.7x 26.7x 23.9x 21.8x 18.2x Cintra 4,921 12,380 BRISA 4,333 6,414 15.3x 14.6x 13.8x 13.2x Average 12.3x 10.9x 10.8x 10.2x Toll road operators valuation – Trading Multiples Toll Road Operators Trading Multiples Note: Numbers in grey have been excluded from average International listed toll road operators are trading at 10x - 11x EBITDA on average
EV EV EV EV Completion Target name Acquiror Acquiror name Stake Stake Purchase Purchase acquired price (%) (%) ( ) Turnover Turnover EBITDA EBITDA EURm Date Pending Pending Autostrade Autostrade Abertis Abertis 100% 100% 14,714 14,714 8.27x 8.27x 13.19x 13.19x 25/04/2006 25/04/2006 SANEF Abertis Abertis / AXA / Credit Agricole 100% 100% 5,324 5,324 8.54x 8.54x 13.26x 13.26x 09/03/2006 09/03/2006 Autoroute Sud de France Vinci Vinci 50% 50% 5,821 5,821 7.83x 7.83x 12.35x 12.35x 20/02/2006 20/02/2006 APRR Eiffage Eiffage / Macquarie Infr. 81% 81% 5,551 5,551 7.64x 7.64x 12.33x 12.33x 20/05/2005 20/05/2005 Hills Motorway Group Transurban 92% 92% 1,074 1,074 25.45x 25.45x na na 19/04/2004 19/04/2004 Hills Motorway Group Transurban 8% 8% 57 57 22.90x 22.90x na na 01/01/2003 01/01/2003 Aurea Acesa (Abertis) 100% 100% 3,102 3,102 11.96x 11.96x na na 16/09/2002 16/09/2002 ACESA Brisa Brisa 6% 6% 219 219 7.34x 7.34x 10.52x 10.52x 05/04/2002 05/04/2002 Autoroute Sud de France Vinci Vinci 14% 14% 771 771 7.10x 7.10x na na 16/01/2002 16/01/2002 Cintra Concesiones Macquarie Infrastructure 40% 40% 741 741 19.70x 19.70x na na Average 8.38x 12.33x Toll road operators valuation – Transaction Analysis Toll Roads M&A Company Transactions Note: Numbers in grey have been excluded from average
Purchase Transaction Stake Target Name Acquirer Name Price EURm acquired % Date 30/06/2006 Indiana Toll Road (US) Cintra/Macquarie Infrastructure 100.0% 3,040 19/12/2005 Westlink M7 (AU) Macquarie Infrastructure Group 5.0% 29 29/09/2005 Dulles Greenway Toll Road (US) Macquarie Infrastructure Group 86.7% 443 29/09/2005 Dulles Greenway Toll Road (US) Macquarie Infrastructure Group 13.3% 70 20/06/2005 Midland Expressway Ltd (UK) Macquarie Infrastructure Group 25.0% 73 na 22/11/2004 Mitcham- Frankston Project (AU) Investor Group 100.0% 443 26/10/2004 407 International Inc (CAN) Macquarie Infrastructure Group 13.9% 46 23/05/2003 San Diego Expressway (US) Macquarie Infrastructure Group 82.0% na 23/05/2003 San Diego Expressway (US) Macquarie Infrastructure Group 16.0% 126 31/03/2002 407 International Inc (CAN) Cintra Concesiones de Infr. 6.0% 16 29/11/2002 Lusoponte (POR) Macquarie Infrastructure Group 5.7% 48 01/10/2002 Aucat (SP) Abertis Infraestructuras 8.8% 350 29/04/2002 407 International Inc (CAN) Macquarie Infrastructure Group 16.1% 93 20/12/2000 Statewide Roads Ltd (AU) Macquarie Infrastructure Group 50.6% 33 20/12/2000 Airport Motorway Group (AU) Macquarie Infrastructure Group 10.5% Toll road operators valuation – Transaction Analysis (cont’d) Toll Roads M&A Asset Transactions
4 • New generation of potential investors
Consorcio Copec Group Quiñenco Group Bancard Solari Group Three main types of potential investors Local buyers • Local Investment Funds: • Clear exit strategies within 3 to 6 years. • Would require IRRs in the range of 12 to 20% depending on the risks associated to the projected cash-flows. • Local Conglomerates: • Would normally seek a strong influence position in the Board. • Would require IRRs ranging from 12 to 20%. CMB Prime Celfin Capital Southern Cross IM Trust Independencia
Macquarie Carlyle ABN AMRO GE Deutsche AM Ontario Teachers Borealis Brookfield CPP KKR Three main types of potential investors (cont’d) International Infrastructure funds • Specialized Infrastructure Funds: • These investors seek assets providing stable, predictable, long-term, monopoly type, inflation-linked returns • Their investment profile allows them to avoid focusing on short-to-medium term exit strategies. • Would normally require IRRs ranging from 11 to 18%. • Long-term Direct Financial Investors: • Seeking larger investment tickets (usually +US$100 m) in infrastructure, real estate and infrastructure type of energy assets. • This category groups Canadian investors that invest pension funds moneys.
OHL Autostrade/ Costanera Norte Acciona ACS Abertis Three main types of potential investors (cont’d) Other (strategic) • Concession operating holdings pursuing a portfolio strategy: • Pursue the opportunity as a way of gaining volume in the regional concession’s market • Focused on positioning the holding for an IPO in the medium term.
5 • Final Remarks – Infrastructure Industry Pending Issues
Final Remarks • Some lessons from the Costanera Norte’s Experience: • Authorization resolution mechanisms • Better response time-frame to allow trading of these shares • Change of investments rules governing local insurance companies and AFPs