Download
1 / 35
350 likes | 423 Views
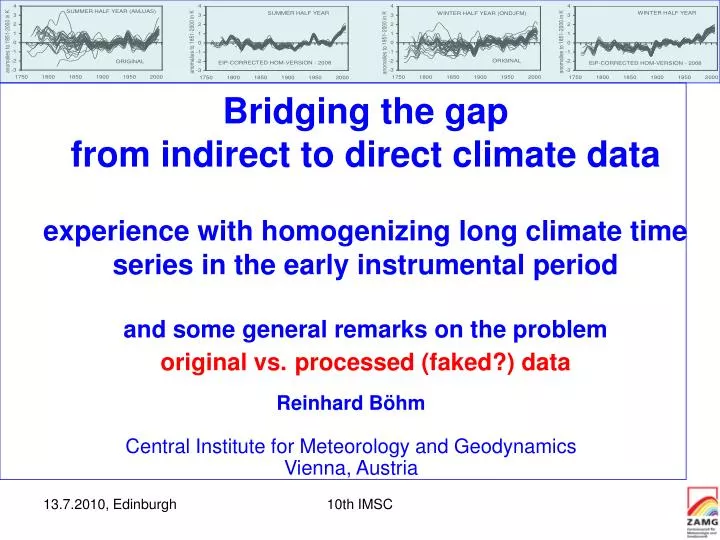
Bridging the gap from indirect to direct climate data experience with homogenizing long climate time series in the early instrumental period and some general remarks on the problem original vs. processed (faked?) data.

E N D
Bridging the gap from indirect to direct climate data experience with homogenizing long climate time series in the early instrumental periodand some general remarks on the problem original vs.processed (faked?) data Reinhard BöhmCentral Institute for Meteorology and GeodynamicsVienna, Austria 10th IMSC Sligachan Hotel Isle of Skye
Bridging the gap from indirect to direct climate data experience with homogenizing long climate time series in the early instrumental periodand some general remarks on the problem original vs.processed (faked?) data Reinhard BöhmCentral Institute for Meteorology and GeodynamicsVienna, Austria 10th IMSC Sligachan Hotel Isle of Skye
Some basic facts on indirect and direct climate information EARLY INSTRUMENTAL PERIOD FULLY DEVELOPED INSTRUMENTAL PERIOD DAWN OF THE INSTRUMENTAL PERIOD Proxies necessary to understand climate variability and trends Proxies and instrumental „at eye level“ Systematic networks of meteorological services Invention of principal meteorological instruments 1597: Thermometer (Galileo) 1643: Barometer (Torricelli) 1732: Anemometer (Pitot) 1769: Hygrometer (Lambert) 1792: Psychrometer (Huton) 1838: Pyrheliometer (Pouillet) 1853: Sunshine recorder (Campbell) 10th IMSC
CLIMATEGATE, 2009:One of the “arguments”: the original datawere intentionally not posed to everybody’s free accessto conceal the “tricks” applied to the original data(to increase the amplitude of anthropogenic warming) My clear answer: (based on some 20 years of experience in the field of homogenizing) WE NEED SUCH TRICKS TO TRANSFER „MEASURED NUMBERS“ TO „CLIMATE DATA“ Let me argue this briefly in the next minutes 10th IMSC
My arguments in a nutshell: • No single longterm climate time series is a priori homogeneous (free from non climatic noise) • At average each 20 to 30 years a break is produced which significantly modifies the series • Many but not all of these single breaks are random if a regional (global) sample is averaged • The biases are of the order of the real climate signal • There are a number of mathematical-statistical procedures which - preferably if combined with metadata information from station history files – are able to detect and remove (or at least reduce) the non climatic information • This is much work which should preferably be done by specialised regional groups close to the metadata – this produces the best results, is more effective and saves the time of research groups wanting to analyse the data 10th IMSC
My Examples will be from Central Europe (HISTALP): • No single longterm climate time series is a priori homogeneous (free from non climatic noise) region: GAR (4 to 19°E, 43 to 49 deg N) more than 500 series on 200 sites 7 climate elements monthly series: quality improved (homogenised, outlier corrected, gaps filled) maximum achievable length (100 to 250 years) element specific network density (190 precip – 60 pressure series) different modes: station mode and 3 different grid-modes • At average each 20 to 30 years a break is produced which significantly modifies the series • Many but not all of these single breaks are random if a regional (global) sample is averaged • The biases of the order of the real climate signal • There are a number of mathematical-.statistical procedures which - preferably if combined with metadata information from station history files – are able to detect and remove (or at least reduce) the non climatic information • This is much work which should preferably be done by specialised regional groups close to the metadata – this produces the best results, is more effective and saves the time of research groups wanting to analyse the data Available in the Web: http://www.zamg.ac.at/histalp 10th IMSC
Examples for: • No single longterm climate time series is a priori homogeneous (free from non climatic noise) • At average each 20 to 30 years a break is produced which significantly modifies the series KLAGENFURT, 1813-2009: 7 relocations – different urban bias • Many but not all of these single breaks are random if a regional (global) sample is averaged • The biases of the order of the real climate signal • There are a number of mathematical-.statistical procedures which - preferably if combined with metadata information from station history files – are able to detect and remove (or at least reduce) the non climatic information • This is much work which should preferably be done by specialised regional groups close to the metadata – this produces the best results, is more effective and saves the time of research groups wanting to analyse the data 10th IMSC
Examples for: • No single longterm climate time series is a priori homogeneous (free from non climatic noise) • At average each 20 to 30 years a break is produced which significantly modifies the series KLAGENFURT, 1813-2009: 7 relocations – different urban bias • Many but not all of these single breaks are random if a regional (global) sample is averaged Klagenfurt composite series: red originalgreen homogenized • The biases of the order of the real climate signal red: original datagreen: homogenized • There are a number of mathematical-.statistical procedures which - preferably if combined with metadata information from station history files – are able to detect and remove (or at least reduce) the non climatic information • This is much work which should preferably be done by specialised regional groups close to the metadata – this produces the best results, is more effective and saves the time of research groups wanting to analyse the data City center Aiport sites 10th IMSC
Examples for: • No single longterm climate time series is a priori homogeneous (free from non climatic noise) • At average each 20 to 30 years a break is produced which significantly modifies the series Precipitation in Karlsruhe with a bias of nearly 100% in the 1870s and 1880s • Many but not all of these single breaks are random if a regional (global) sample is averaged • The biases of the order of the real climate signal • There are a number of mathematical-.statistical procedures which - preferably if combined with metadata information from station history files – are able to detect and remove (or at least reduce) the non climatic information • This is much work which should preferably be done by specialised regional groups close to the metadata – this produces the best results, is more effective and saves the time of research groups wanting to analyse the data 10th IMSC
Examples for: • No single longterm climate time series is a priori homogeneous (free from non climatic noise) • At average each 20 to 30 years a break is produced which significantly modifies the series • Many but not all of these single breaks are random if a regional (global) sample is averaged • The biases of the order of the real climate signal • There are a number of mathematical-.statistical procedures which - preferably if combined with metadata information from station history files – are able to detect and remove (or at least reduce) the non climatic information • This is much work which should preferably be done by specialised regional groups close to the metadata – this produces the best results, is more effective and saves the time of research groups wanting to analyse the data 10th IMSC
Examples for: • No single longterm climate time series is a priori homogeneous (free from non climatic noise) • At average each 20 to 30 years a break is produced which significantly modifies the series • Many but not all of these single breaks are random if a regional (global) sample is averaged • The biases of the order of the real climate signal • There are a number of mathematical-.statistical procedures which - preferably if combined with metadata information from station history files – are able to detect and remove (or at least reduce) the non climatic information • This is much work which should preferably be done by specialised regional groups close to the metadata – this produces the best results, is more effective and saves the time of research groups wanting to analyse the data 10th IMSC
An example for systematic biases: EARLY PRECIP- SERIES • No single longterm climate time series is a priori homogeneous (free from non climatic noise) kk. Hydrographisches Amt in Pula: 2 sites (25 years of parallel measurements) • At average each 20 to 30 years a break is produced which significantly modifies the series • Many but not all of these single breaks are random if a regional (global) sample is averaged • The biases of the order of the real climate signal • There are a number of mathematical-.statistical procedures which - preferably if combined with metadata information from station history files – are able to detect and remove (or at least reduce) the non climatic information • This is much work which should preferably be done by specialised regional groups close to the metadata – this produces the best results, is more effective and saves the time of research groups wanting to analyse the data Early rain-gauges systematically higher above ground early precip-series systematically too dry 10th IMSC
Another problem a bit more in detail here: the EARLY INSTRUMENTAL TEMPERATURE BIAS described in: Büntgen U, Frank DC, Nievergelt D, Esper J 2006. Summer temperature variations in the European Alps: AD 755-2004. Journal of Climate 19: 5606-5623 Hiebl J, 2006. The early instrumental climate period (1760-1860) in Europe. Evidence from the Alpine region and Southern Scandinavia Diploma Thesis, Inst. f. Geography, Uni-Wien, 103 pages Frank D, Büntgen U, Böhm R, Maugeri M, Esper J, 2008. Warmer early instrumental measurements versus colder reconstructed temperatures: shooting at a moving target. Quaternary Science Reviews, (2008), doi:10.1016/j.quascirev.2007.08.002 Böhm R, Jones PD, Hiebl J, Brunetti M, Frank D, Maugeri M, 2010 THE EARLY INSTRUMENTAL WARM-BIAS: A SOLUTION FOR LONG CENTRAL EUROPEAN TEMPERATURE SERIES 1760-2007 Climatic Change101: 41-67 10th IMSC
The HISTALP-early instrumental potential NW NE S alle HISTALP sites NE NW S 10th IMSC
248 years of GAR-temperature: the result so far (version 2006) original series (smoothed) homogenized ? ? 10th IMSC
the nucleus of the EI-problem: Diverging instrumental and proxy warm season temperatures before 1860 Described in: Frank et al, 2007 Hiebl , 2007 Büntgen et al., 2005 pre-1860 HISTALP temperatures pre-1860-proxy temperatures (here: high elevation TRX-series) 10th IMSC
Our solution: strictly staying within the instrumental domain: • Intensive re-analysis of station history of the more than 30 EI-series • Combined with the evidence fromKremsmünster: • (multianual parallel measurements of a preserved originalEI-sitewith a nearby typical modern installation(AustrianTAWES network) 10th IMSC
The Kremsmünster evidence Orientation NNE 6m above ground Mean differences historic minus modern installation 10th IMSC
4 examples from the intensive new metadata studies : Not important in this context, but very impotant for tx, tn DTR-studies: 10th IMSC
4 examples from the intensive new metadata studies : important for EIP-tm-bias-correction (for chosing the convenient corr-model) 10th IMSC
„from – to“: the individual lengths of the EIP: 80% of the introduction of regular screens happened within 15 years 10th IMSC
the individual EIP-bias corrections series with sufficient metadata detection series with insufficient metadata detection 10th IMSC
THE RESULT:mean over all 32 singleEI-series(20-yrs- smoothed, anomalies from 1978-2007 average) • No single longterm climate time series is a priori homogeneous (free from non climatic noise) 1971: evening observations from 9pm tp 7pm in AT and CH original • At average each 20 to 30 years a break is produced which significantly modifies the series homogenized-2006 Since 1980s: automation of networks ??? – effects not clear yet • Many but not all of these single breaks are random if a regional (global) sample is averaged • The biases of the order of the real climate signal EIP-corrected-2008 • There are a number of mathematical-.statistical procedures which - preferably if combined with metadata information from station history files – are able to detect and remove (or at least reduce) the non climatic information WW-2: systematic relocations from historic centers to airports THE NETWORK BECOMES MORE RURAL! • This is much work which should preferably be done by specialised regional groups close to the metadata – this produces the best results, is more effective and saves the time of research groups wanting to analyse the data 1830s to 1870s: systematic EI-bias due to insufficient shading of thermometers 10th IMSC
Total of systematic temperature-biases: • No single longterm climate time series is a priori homogeneous (free from non climatic noise) original • At average each 20 to 30 years a break is produced which significantly modifies the series homogenized-2006 SYSTEMATIC BIAS = +0.55°C • Many but not all of these single breaks are random if a regional (global) sample is averaged • The biases of the order of the real climate signal EIP-corrected-2008 • There are a number of mathematical-.statistical procedures which - preferably if combined with metadata information from station history files – are able to detect and remove (or at least reduce) the non climatic information • This is much work which should preferably be done by specialised regional groups close to the metadata – this produces the best results, is more effective and saves the time of research groups wanting to analyse the data SYSTEMATIC BIAS = +0.45°C 10th IMSC
THE RESULT:mean over all 32 singleEI-series(20-yrs- smoothed, anomalies from 1978-2007 average) Smoothed annual means Smoothed seasonal asymmetry: 19th century more continental than 20th This has severe implications due to the given seasonal asymmetry of many natural proxies 10th IMSC
OUR RESULT:compared to otherEIP-series(20-years smoothed, anomalies from1851-2000 average) Moberg ori corr CRU-CEN CRU-CEU De-Bilt St.Petersburg ISAC Northern Italy bold black: HISTALP-LSS-Tm-2008, EI-corrected (Böhm et al., 2008), bold grey: HISTALP-LSS-Tm-2007, not EI-corrected (Auer et al, 2007), thin red: ISAC-homogenised, mean of 7 N-Italian series (Brunetti et al., 2006b), thin pink: Central European mean of CRUtem2v gridboxes 40-50N, 10-20E (Trenberth and Jones, 2007), thin light blue: Uppsala-Stockholm mean, not EI-corrected (Moberg et al., 2002, Bergström and Moberg, 2002), thin dark blue: Uppsala-Stockholm mean, EI-corrected (Moberg et al., 2003, Moberg et al., 2005), thin green: central England series (Manley, 1974, Parker et al., 1992), thin violet: de Bilt series (van Engelen et al., 1995), thin brown: St. Petersburg series (Jones and Lister, 2002) My conclusion: we are nearer to the truth now but to be realistic, we still have an unpleasant „spaghetti-type“ situation in the early instrumental period 10th IMSC
THE REMAINING THREE POINTS: • No single longterm climate time series is a priori homogeneous (free from non climatic noise) • At average each 20 to 30 years a break is produced which significantly modifies the series • Many but not all of these single breaks are random if a regional (global) sample is averaged • The biases are of the order of the real climate signal • There are a number of mathematical-.statistical procedures which - preferably if combined with metadata information from station history files – are able to detect and remove (or at least reduce) the non climatic information • This is much work which should preferably be done by specialised regional groups close to the metadata – this produces the best results, is more effective and saves the time of research groups wanting to analyse the data 10th IMSC
the size of the problem: breaks – outliers - gaps Sample: all HISTALP temperature series (135) • No single longterm climate time series is a priori homogeneous (free from non climatic noise) breaks gaps • At average each 20 to 30 years a break is produced which significantly modifies the series • Many but not all of these single breaks are random if a regional (global) sample is averaged • The biases are of the order of the real climate signal • There are a number of mathematical-.statistical procedures which - preferably if combined with metadata information from station history files – are able to detect and remove (or at least reduce) the non climatic information outliers • This is much work which should preferably be done by specialised regional groups close to the metadata – this produces the best results, is more effective and saves the time of research groups wanting to analyse the data 10th IMSC
LIKE A 15 YEARS OLD SINGLE MALT: INTERNATIONAL JOURNAL OF CLIMATOLOGY 18: 1493–1517 (1998) HOMOGENEITY ADJUSTMENTS OF IN SITU ATMOSPHERIC CLIMATE DATA: A REVIEW THOMAS C. PETERSON, DAVID R. EASTERLING, THOMAS R. KARL, PAVEL GROISMAN, NEVILLE NICHOLLS, NEIL PLUMMER, SIMON TOROK, INGEBORG AUER, REINHARD BOEHM, DONALD GULLETT, LUCIE VINCENT, RAINO HEINO, HEIKKI TUOMENVIRTA, OLIVIER MESTRE, TAMAS SZENTIMREY, JAMES SALINGER, EIRIK J. FØRLAND, INGER HANSSEN-BAUER, HANS ALEXANDERSSON, PHILIP JONES and DAVID PARKER TAKE-HOME MESSAGE 1: • No single longterm climate time series is a priori homogeneous (free from non climatic noise) • At average each 20 to 30 years a break is produced which significantly modifies the series Alexandersson • Many but not all of these single breaks are random if a regional (global) sample is averaged Caussinus-Mestre Peterson-Easterling • The biases of the order of the real climate signal SNHT PRODIGE Della Marta Bradley-Jones • There are a number of mathematical-statistical procedures which - preferably if combined with metadata information from station history files – are able to detect and remove (or at least reduce) the non climatic information Currently some of them are critically analysed and compared within cost action HOME • This is much work which should preferably be done by specialised regional groups close to the metadata – this produces the best results, is more effective and saves the time of research groups wanting to analyse the data MASH Vincent Szentimrey Craddock 10th IMSC Rhodes-Salinger HOCLIS
TAKE-HOME MESSAGE 2: • No single longterm climate time series is a priori homogeneous (free from non climatic noise) • At average each 20 to 30 years a break is produced which significantly modifies the series • Many but not all of these single breaks are random if a regional (global) sample is averaged • The biases of the order of the real climate signal • There are a number of mathematical-.statistical procedures which - preferably if combined with metadata information from station history files – are able to detect and remove (or at least reduce) the non climatic information • This is much work which should preferably be done by specialised regional groups close to the metadata – this produces the best results, is more effective and saves the time of research groups wanting to analyse the data BUT: 10th IMSC
A challenge not adequatly solved yet : • The ongoing automation of networks • e.g.: the change from CAPBELL-STOKES to photoelectric sunshine recorders An example from 10 Austrian sites with parallel measurements – 4 at high and 6 at low elevation Wetting losses at Low elev. sites in winter Overburning at H-elev.-sites due to intermittant cumulus clouds there in summer 10th IMSC
Another one: • DOING THE STEP FROM MONTHLY RESOLVED TO DAILY SERIES • THE MAIN PROBLEM: HIGHER NETWORK DENSITY NECESSARY – IN PARTICULAR FOR PRECIPITATION SPATIAL DECORRELATION TO 50% COMMON VARANCE (EUROPE, SYNOP NETWORK) Source: Scheifinger and Böhm, 2005) 10th IMSC
More about the homogenizing business: this afternoon (14.30-17.45) in session 8 (St. Trinneann) Starting with Olivier Mestre‘s and Victor Venema‘s homogenization procedures intercomparison (cost action HOME) and at the poster session 8 (Pentland) starting here right now 10th IMSC
THANK‘S FOR LISTENING ANYWAY MUCH OF WHAT I HAVE SAID TO AN AUDITORIUM LIKE THIS WAS OF COURSE CARRYING OWLS TO EDINBURGH 10th IMSC