Download
1 / 25
250 likes | 381 Views
Understanding our Water Footprint: De-risking Operations. Ed Kirk, Johns Hopkins University. Jonathan Lanciani , Sustainable Water. Water Apocalypse. Only 5-10% of “drinking” water produced will be used for consumption. http:// www.virginiaplaces.org /watersheds/ drinkwater.html.

E N D
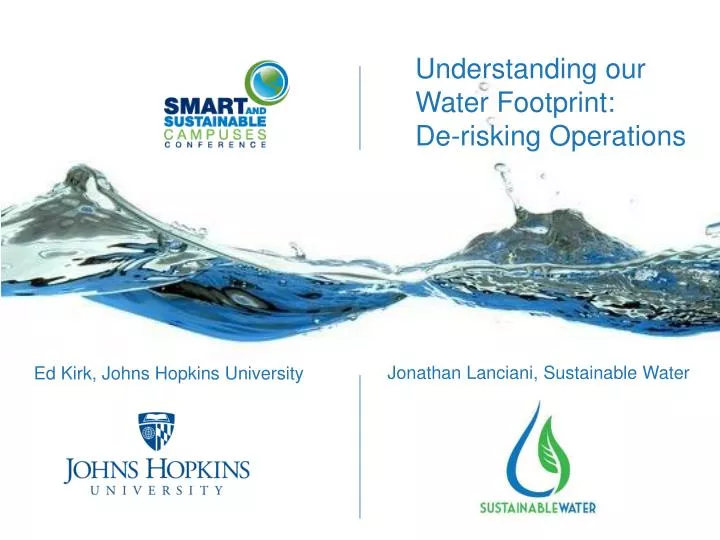
Understanding our Water Footprint: De-risking Operations Ed Kirk, Johns Hopkins University Jonathan Lanciani, Sustainable Water
Water Apocalypse Only 5-10% of “drinking” water produced will be used for consumption. http://www.virginiaplaces.org/watersheds/drinkwater.html History of drought in region Risks: Rates, Availability, Infrastructure, Environmental Pressure
A more sustainable water cycle…Decentralized Reclamation and Reuse Before After
Water: The Lynchpin toJHU’s Way of Life Solutions for a Range of End Users
Johns Hopkins University • Est. 1876 • 20 M GSF ofBuildings • 21 MW of CHP across 5 systems • 50,000 tons ofcoolingandsteam • 320 M Gallonsofwaterannually Mission: Ensure JHU is sustainable and remains strong and vibrant
2009 JHU Task Force on Climate Change • From the Committee: • Possible to reduce GHG by 141,600 MT CO2e • No one way to reach the goal. • Business as Usual growth rate: 0.3% annually. • Result = 51% reduction in GHG by 2025.
JHU Sustainability Efforts • Since 2008: • Reduced GHG Emissions by 23% while the campuses have grown by 9% • Sustainable Purchasing initiatives • LEED certification on 12 buildings • Waste diversion increased more than 50% • Already conserving and treating stormwater But what about water?? Water use ROSE 9% in 2010
What’s Been Done… Energy Efficiency and the CHP at JHU 3 Cogeneration Plants (18MW) Increases Plant EE & Reduces carbon footprint Trigeneration Plant (1.5MW) 85% better than grid electricity Small CHP (75KW Modules) Results: Displace High Carbon content grid electricity Capture & use waste heat
National Recognition Setting Standards for Efficiency and Reliability
Risks to Water Rising Rates $14.20 $12.79 $11.52 $10.54 Maryland’s Aging Infrastructure $13 billion Infrastructure Investment Needs Through 2030 Baltimore: Rates set to rise 11% over next 2 years
Risk Mitigation Campus water objectives: • Redundant Water Supply • Drought • Municipal infrastructure failures • Additional On-Site Storage • Flexibility & Resilience • Independence • Availability in the event of failure • Minimum recovery time • Insulation from rising water costs Drought Rising Rates Aging Infrastructure N+1: Reliable and Safe Alternatives to Potable Water
Solution: Reuse WaterA logical extension to conservation efforts • Operational • De-risks operations with an alternative water source • Protects against mandatory conservation programs • Cost Savings • Discounted water rates • Reduced potable water intake • Reduced sewer fees • Environmental & Social • Decreases diversion of water from ecosystems • Decreases wastewater discharge • Net energy efficiency gains • Reclaimed water shows no danger to public health Eliminate Risks, Save Money and Increase Sustainability
Centralized vs. Decentralized Reuse Water Treatment Facility End User ~10+ miles Wastewater Reclaimed Water The Embodied Energy of Water Impractical for Baltimore, MD
Overview Utility Water Assessment • Equipment inventory • Program admin. • Water quality needs • Reclaimed water modeling Water Footprint Assessment & Economic Validation • Water balance & use • Non-potable demand • WW flow projections • Economic assessment Site & Infrastructure Assessment • Infrastructure review • Regulatory review • Prelim. siting & design • Lifecycle Savings Validating Impact & Developing a Plan
Utility & Sewer Data Non-potable Process Water Demand Predictable Demand
Some Independent Power ProducersCurrently Using Reclaimed Water Water Reuse is Prevalent Amongst IPPs
Utility Utility Assessment • Feasibility and treatability studies • Scale inhibitors • Sludge dispersants • Treatment specifications • Purity studies • Corrosion studies • Fuel conservation studies Biological studies Corrosion studies Automation Treatability studies Equipment Integrity Superior Program Oversight: Unparalleled Collaboration
88,000 GPD 508,000 GPD 175,000 GPD
Water Purchase Agreement Flexible project financing arrangements utilizing: ~ Performance Contracts ~ Operating Leases ~ Design-Build Agreements Benefits • No up-front capital • Innovative Technologies • Leverages superior credit rating • Immediate, Guaranteed Savings • Long Term Pricing Stability • No O&M Responsibilities • SW bares majority of risk Water is Principal to Facility Operations
The WaterHub™ Student Engagement: Functional, but also a Living, Learning Classroom
Water Reuse in Urban Spaces VS. Decentralization Creates New Dynamics: Safety, Aesthetics & Footprint
Complex, Adaptive Ecosystems Increased Biodiversity, Reduced Energy Requirements
Reciprocating Tidal Wetlands Paired ReCip Cells Filtration & Disinfection Mechanical Room Plants & Supporting Media Root Zone Primary Tank Artificial Media Reuse Tank Aeration
QUESTIONS? Ed Kirk (443) 997-2343 ekirk3@jhu.edu Jonathan Lanciani (804) 965-5590 Jonathan.Lanciani@sustainablewater.com