Download
1 / 113
1.81k likes | 2.86k Views
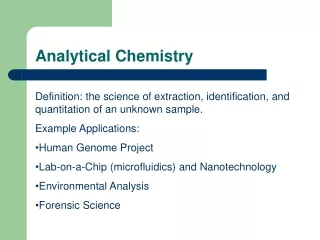
ENVIRONMENTAL ANALYTICAL CHEMISTRY. Angela Chang Mausami Desai Katie Sovik. Winter 1999. PRINCIPLES To experience and practice a variety of techniques useful in analyzing natural environmental processes. This includes complex biological, chemical, geological, and physical phenomena.

E N D
ENVIRONMENTAL ANALYTICAL CHEMISTRY Angela Chang Mausami Desai Katie Sovik Winter 1999
PRINCIPLES To experience and practice a variety of techniques useful in analyzing natural environmental processes. This includes complex biological, chemical, geological, and physical phenomena. • This laboratory utilizes some of the state-of-the-art instrumentation currently available, noting the accuracy of results that can be obtained. • The focus is split between a lesson on instrumentation and results analysis.
OBJECTIVE This course specifically focuses on characterizing naturally occurring organic matter (NOM) because of its influence on the bioavailability and activity of pollution. The following analyses provide an introduction to important laboratory instrumentation while addressing a significant environmental material.
CONTENTS • Characterization of Total Organic Carbon • Capillary Electrophoresis • Potentiometric Methods • Glucosidic & Proteinaceous Fractions of DOM • DOM Fingerprinting by PY-GC-MS
TOTAL ORGANIC CARBON OBJECTIVE: Quantify overall organic carbon concentrations, and the dissolved and particulate fractions. • This is a generalized starting point in analyzing naturally occurring organic matter. Subsequent procedures determine more specific characterizations of the types of organic material or carbon.
TOTAL ORGANIC CARBON ANALYSIS • by Automated Carbon Analyzer (UV Persulfate Oxidation) • by UV Spectroscopy
Automated Carbon Analyzer 2 STEP TOC ANALYSIS PROCEDURE: Principals • By UV persulfate oxidation the sodium persulfate and phosphoric acid reagents convert all organic matter CO2 • Measuring CO2 concentrations suggests organic carbon concentration • The infrared absorbance detector measures and quantifies this CO2 as ppm total C
UV PERSULFATE OXIDATION REACTIONS: • Excitation by UV light produces the primary oxidants (sulfate and hydroxide radicals) S2082- + v 2SO4- H20 + v H+ + OH • UV light also breaks down the organic material into radical functional groups. R + v R
UV PERSULFATE OXIDATION The combination of these 2 types of radicals oxidizes the organic matter releasing CO2. R + SO4- + H20 nCO2 + ... Ultimately a measure of the amount of CO2 produced quantifies the TOC
Dohrman DC-180 Carbon AnalyzerFlow Diagram See next page for system operations explanation
System Operations • A pump fills the pickup loop with sample • Specific amounts of sample and acid are injected into the sparger • Acidification with H3PO4 in the sparger strips the inorganic (IC) and purgeable carbon (PuOC) from the sample. Separation of these fractions is aided by a bubbling flow of O2(g) • The nonparticulate organic carbon (NPOC) remaining in the liquid sample is sent to the UV reactor by another injection loop • UV radiation and the persulfate reagents oxidize all organics in the sample
System Operations (continued) • The CO2(g) and OH-(g) are directed to the Gas/Liquid separator and bubbled with acidified water. A pH of 3 is maintained to aid the elimination of water from the CO2. • The infrared absorbance of water significantly overlaps with our focus, CO2. The removal of water in an osmotic pressure dryer is thus important. • In the Nondispersive Infrared Detector (NDIR) the absorbance of infrared radiation measures CO2. • The computer calculates and displays this as ppm C.
Interferences There are 3 significant types of interferences related to the instrument procedure and components of the samples : • The incomplete removal of inorganic and purgeable carbon in the sparger • The incomplete oxidation of the organic material in the UV reactor • Chloride present in the sample absorbing UV radiation
Calibration Curvecounts = (15,500 +/- 102.4)conc - 540.6 +/- 1213
Calibration • 5 standards of known C-concentration were made from KHP (K-acid phtalate) • These concentrations ranged from 1-20 ppm • 2 blank samples were also analyzed and used to zero the calibration • The error on the intercept is larger than the actual intercept estimate and insignificant with respect to the origin • This intercept value can be disregarded • Considering this was our first time doing error analysis, we included all error estimates in our calculations.
Organic Carbon Calculations Calculations are based on average values of triplicate readings from the machine for each sample
Organic Carbon Calculations • Dissolved particles are defined as that smaller than 0.45 m by the filters used • Suspended/colloidal materials ineffectively separated by filtration can thus be misrepresented as dissolved • This is a possible explanation for the large DOC values, misleadingly close to the TOC • The resultant small POC calculations suggest large amounts of colloidal material • The error carried over from the total and dissolved carbon values is greatly amplified in the POC calculations making them essentially insignificant
TOC - Sheboygan River Corporate PCB’s Kohler Company
Trends Sheboygan River : • The organic carbon levels are greatest upstream of the PCB’s input • The Kohler Co. does not seem to effect the carbon levels • Overall there is about a 2 ppm downstream decrease in TOC Lake Depue : • No seasonal effects on TOC are noted • There is evidence that the lake is highly colloidal
UV SPECTROSCOPY Principle : Different compounds at certain wavelengths show unique and specific absorbances. The following methods attempt to quantify the fractions or concentrations of different types of organic matter from absorbance spectra.
UV SPECTROSCOPY • Correlation methods in particular, have been used as estimates in characterizing : • Humidification • % Aromaticity • TOC • The UV-254 correlation with TOC useful for specific water types has continued to be mentioned and documented because of the simplicity of the procedure and the portability of spectroscopy equipment. Even though automated carbon analyzers are more widely accurate, this method has shown some advantages.
UV SPECTROSCOPY • Transmittance is the fraction of incident light transmitted by a solution • This cannot be measured directly in the lab due to reflective interferences with any container used to hold the sample • Beer’s Law (For use with dilute solutions only) Absorbance = - log T = bc • = molar absorptivity [L/mole*cm] • b = the path length through the solution • c = concentration
Spectrophotometer 1 - D2 lamp 2 - Grating 1 3 - Entrance Slit 4 - Grating 2 5 - Exit Slit 6 - Chopper 7 - Sample & Reference Positions 8 - Chopper 9 - Photo Tube
Spectrophotometry • Mirrors and gratings redirect and disperse the radiation • The slits limit the radiation range allowing successively isolated wavelengths to be selected • The rotating chopper wheels alternately direct the light beam through the sample and reference • A distilled water reference is required to zero the interference effects of the cuvette Other Interferences include : chloride absorbance particulate scattering non-absorbing organic material
Absorption Ratios : Characterizations Although negative values are useless, the ratios developed have been used to characterize soil type and degree of humidification
E4/E6 & E2/E3 Ratios :Humic Substances • Constitute a large portion of the organic matter in soils • Product of the degradation of plant and animal materials & microorganism activity • Aromatic • acidic • Hydrophilic • Flexible Polyelectrolytes • Lignin is the second most abundant polymer synthesized by plants and a structural unit for humics
Biochemistry & Significance • The aromatic building blocks of humic substances are connected by flexible low energy bonds • Reactions and voids aggregate/trap other materials • Metals ions and toxic organic pollutants are stabilized in complexes
Humidification AnalysisE4/E6 & E2/E3 Ratios • Even though our results are inconclusive • low E4/E6 ratios have been found to indicate a high degree of aromatic humic constituency • High E4/E6 ratios indicate low aromaticity, or a high degree of aliphatic structure E4/E6 Humic Acids 3.8 - 5.8 Fulvic Acids 7.6 - 11.5
Humidification AnalysisE4/E6 & E2/E3 Ratios • Less data has been compiled for E2/E3 ratios and thus they are less reliable although certain characterizations have been documented E2/E3 Strongly humic and oligotrophic lakes 4.0 Chlorolignin 4.2 5.7 Lignin
Aromaticity • Aromaticity of organic matter is a specific structural factor significant to interactions with pollutants, and their stabilization • The higher the aromatic fraction of DOM, the higher the xenobiotic binding capacity • A simple equation for % Aromaticity has been developed that is dependant on molar absorptivity = A/bc Aromaticity = 0.05 + 6.74 Primary assumption : all organic matter absorbs the same at any wavelength and that also absorbs as the KHP standard, i.e. the of all organic matter is the same. This assumption in actuality is not valid, as varies for different types of organic matter.
TOC Surrogate • UV absorbance at 254 nm is documented as a widely used substitute for TOC • We analyzed the filtered samples in the spectrophotometer and thus ultimately compared DOC approximations from the 2 methods
Non-Acidified Pseudo Calibration Curveabs =(0.01953 +/- 0.002089)(ppm C) - 0.01740 +/- 0.01393
Non-Acidified Pseudo Calibration Curve • Only 3 standards solutions ranging from 5 - 20 ppm C, and a blank were analyzed • the standards were diluted from a KHP stock • the samples were zeroed by the spectrophotometer • the 10 ppm standard introduced error
TOC - Comparisons The ppm C derived by the UV-254 correlation is doubly overcompensated. Greater error values must also be noted as a result of the limited calibration.
Note • The effects of the colloidal particles noted in the POC calculations is greatly amplified in the UV-254 method • The scattering action of the colloidal material is one explanation for high absorbance readings and the overcompensation for TOC • It is common belief that UV persulfate oxidation and automated carbon analysis is the more accurate method in determining TOC • Although this exercise allowed a realization of the potential advantages and real limitations of experimental procedures
Capillary Electrophoresis OBJECTIVE: Determination of concentration of specified ions in sample waters
Introduction • Electrophoresis is the migration of ions in solution under influence of electric field. In a typical capillary electrophoresis (CE) application, use an electric field of 15-30 kV to separate the components inside a fused silica capillary tube. • Since different solutes have different mobilities, they will migrate through the capillary at different speeds • This gives the extraordinary resolution and separation of many ionic species.
Electrophoresis • When an ion with charge q is placed in an electric field E, the force on the ion is: F = q*E • In solution, the other major force on the ion is the retarding frictional force f*vep, where vep is the electrophoretic velocity and f is the coefficient of friction: vep= q*E/f = µepE • The constant of proportionality between speed of ion and the applied electric field is: µep • µep is proportional to the charge on the ion and inversely proportional to the friction coefficient.
Electroosmosis • The inside surface of the silica capillary is covered with silanol (Si-OH) groups which carry a negative charge above pH=2 • These negative charges on surface induce cations to neutralize some of the surface charge • The constant of proportionality between electroosmotic velocity (veo) and applied field is the electroosmotic mobility: µeo • A relationship for the electrophoretic effect is: veo=µeo*E
Diagram: Hydrodynamic Velocity Profile • (a) Positive charges move toward cathode, absorbed on surface of glass • (b) More dispersion created by velocity profile because pushed from middle
Apparent Mobility • The apparent (or observed) mobility (app) of an ion is the sum of the electrophoretic mobility of the ion and the electroosmotic mobility of the solution: app= ep+ eo • For a cation moving in the same direction as the electroosmotic flow, the mobilities have the same sign and then app is greater than ep
Diagram: Solute Mobilities • (a) Optimize electrolyte conditions to make separation larger and force ions out of system faster • (b) Use TTAB as reversal compound to separate anions out first • (c) Sum of all ions out of sides of capillary
Diagram: Apparatus • Both ends of capillary placed into electrolyte • Sample injected by siphon effect • Insert capillary into vial and elevate • After injection, vial returned to normal height • Apply voltage of 15kV • Ions migrate through electrolyte • Indirect detection
Br- SO42- Cl- NO3-