Download

1 / 21
220 likes | 453 Views
Introduction to Linear Programming. Chapter 3: Hillier and Lieberman Dr. Hurley’s AGB 328 Course. Terms to Know.

E N D
Introduction to Linear Programming Chapter 3: Hillier and Lieberman Dr. Hurley’s AGB 328 Course
Terms to Know • Simplex Method, Feasible Region, Slope-Intercept Form, Optimal Solution, Graphical Method, Decision Variables, Parameters, Objective Function, Constraints, Functional Constraints, Non-Negativity Constraints, Feasible Solution, Infeasible Solution, Feasible Region
Terms to Know Cont. • No Feasible Solution, Optimal Solution, Most Favorable Value, Multiple Optimal Solutions, Multiple Optimal Solutions, No Optimal Solutions, Unbounded Z, Corner-Point Feasible Solution (CPF), Blending Problem, Data Cells, Range Name, Changing Cells, Output Cells, Target Cell
Wyndor Glass Co. Example • Company has two new products—a door and a window • The company has three plants to develop these two new products • The goal of the company is to maximize profits
Mathematical Model • Let x1 = number of doors produced per week • Let x2= number of windows produced per week • Let Z = profit per week Subject to: 2
Graphical Solution x1=4 x2 9 2x2=12 6 3x1+2x2=18 Z=3x1+5x2=36 Z=3x1+5x2=20 0 6 4 x1 Z=3x1+5x2=10
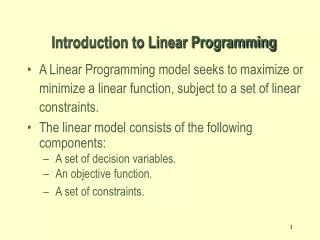
The General Linear Programming Model • Z = measure of performance • xj = a decision variable that indicates how much you are doing of activity j for j = 1, 2, …, n • cj = a parameter that converts activity j into the overall measure of performance • bi = the amount of resource i you have availableto allocate to your different activities for i= 1, 2, …, m • aij = a parameter that converts activity j into the amount of resource i used
Standard Mathematical Form Subject to: . . , …,
Changes that Can Be Made to the Standard Form • The objective function could be minimized instead of maximized • The functional constraints can be met with equality (=) or greater than (≥) signs • The decision variables xj could be unrestricted in sign, i.e., xj< 0 is also possible
Major Assumptions Behind Linear Programming • All functions are linear • Proportionality Assumption • Additivity • Divisibility • Certainty
Solving Linear Programming Problems Using a Spreadsheet • Excel has an add-in called Solver that can solve linear programming problems. • Major components to Solver are: • Set Objective: • To: • By Changing Variable Cells: • Subject to the Constraints: • Make Unconstrained Variables Non-negative should be checked • Select a Solving Method:
Guidelines for Building Good Spreadsheets • Enter the data first • Since the data can dictate the structure of the spreadsheet model, it is valuable to input the data in the spreadsheet first. • This can also allow you to build the spreadsheet to closely resemble the structure of the data. • Organize and clearly identify the data • Data should be grouped together in a convenient format. • Each piece of data or group of data should be appropriately labeled.
Guidelines for Building Good Spreadsheets Cont. • Enter each piece of data into one cell only • If you need to use the data elsewhere in the model, you can reference it. • Separate data from formulas • If possible, formulas should have no specific parameters encoded in them. • By keeping the data separate from formulas, you can save time when changes are needed by only having to change one parameter rather than looking for all the formulas that use a specific piece of data. • This allows all the data to be visual in the spreadsheet.
Guidelines for Building Good Spreadsheets Cont. • Keep it simple • You should avoid more powerful functions when simpler ones will accomplish the same task. • Keep formulas simple. • If you have a very complicated formula, you should break it up into components on the spreadsheet. • Use range names • Range names should be indicative of what they represent. • When using range names, care should be taken not to allow too many range names so the names become unwieldy.
Guidelines for Building Good Spreadsheets Cont. • Use relative and absolute references to simplify copying formulas • This also allows you to copy cells without making as many errors. • Use borders, shading, and colors to distinguish between cell types • This will make it easy for you to keep track of the items within your spreadsheet model.
Guidelines for Building Good Spreadsheets Cont. • Show the entire model on the spreadsheet • You should attempt to put as many of the elements of the model on the spreadsheet. • This will allow others to more easily understand your model. • This will allow people using the spreadsheet to more easily understand the Solver dialog box.
Review the Following Spreadsheet Models • Wyndor Glass • Radiation Therapy • Kibbutzim • Nori and Leets • Save-It • Union Airways • Distribution Unlimited
Example • 3.1-10 in the textbook • Develop a mathematical model • Solve the problem using the graphical method • Solve the problem using excel by developing a spreadsheet model
In-Class Activity (Not Graded) • Solve the following using the graphical method and the spreadsheet method: Subject to: