Download
1 / 5
50 likes | 166 Views
Advanced Algebra. What is a Normal Distribution?. Normal Distribution. Bell Curve. Normal Distribution Curve. How data should fall in a normal distribution Standard Deviation ( ) – frequency distribution of a certain number. x = 68.3% x 2 = 95.5% x 3 = 99.7%

E N D
Advanced Algebra What is a Normal Distribution?
Normal Distribution Bell Curve
Normal Distribution Curve How data should fall in a normal distribution Standard Deviation () – frequency distribution of a certain number. x = 68.3% x 2 = 95.5% x 3 = 99.7% This is known as the empirical rule.
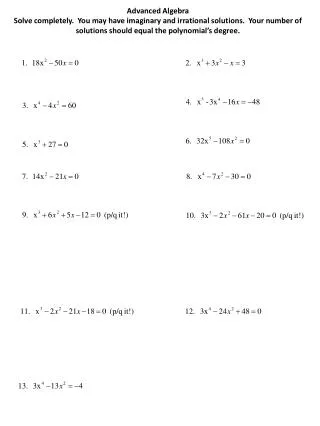
The weight of a box of cereal averages 565 with a standard deviation of 5 grams. You have 6000 boxes. What percentage weigh between: 560 – 570 555 – 575 550 – 580 565 – 580
A set of 1000 pieces of data has a normal distribution. The mean of the data is 120, and the standard deviation is 20. How many values are within one standard deviation of the mean? What percentage of the data is between 120 and 160?