Download
1 / 124
1.24k likes | 1.25k Views
Protein-protein interactions: structure and systems approaches to analyze diverse genomic data. Anna R. Panchenko Benjamin A. Shoemaker NCBI / NIH. Importance of protein-protein interactions. Many cellular processes are regulated by multiprotein complexes.

E N D
Protein-protein interactions: structure and systems approaches to analyze diverse genomic data Anna R. Panchenko Benjamin A. Shoemaker NCBI / NIH
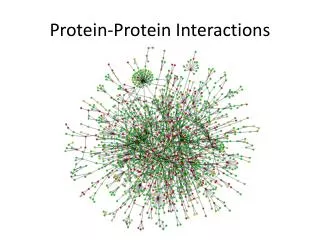
Importance of protein-protein interactions. • Many cellular processes are regulated by multiprotein complexes. • Distortions of protein interactions can cause diseases. • Protein function can be predicted by knowing functions of interacting partners (“guilt by association”). A comparison of sequence (GenBank) and protein-protein interaction data (DIP database) Adapted from S. Fields, FEBS, 2005 2
Outline • Introduction • Experimental techniques • Protein and domain interaction databases • Prediction of protein/domain interactions • Homology modeling of interaction interfaces • Protein interaction networks 3
Example: interaction of guanine-nucleotide binding domain with different effectors. Adapted from Vetter & Wittinghofer, Science 2001 4
Common properties of protein-protein interactions. rim • Majority of protein complexes have a buried surface area ~1600±400 Ǻ^2 (“standard size” patch). • Complexes of “standard size” do not involve large conformational changes while large complexes do. • Protein recognition site consists of a completely buried core and a partially accessible rim. • Trp and Tyr are abundant in the core, but Ser and Thr, Lys and Glu are particularly disfavored. core Top molecule Bottom molecule 5
Different types of protein-protein interactions. • Permanent and transient. • External are between different chains; internal are within the same chain. • Homo- and hetero-oligomers depending on the similarity between interacting subunits. • Interface type can be predicted from amino acid composition (Ofran and Rost 2003). 6
Conservation of protein-protein interactions. • Conservation of protein interfaces is weak compared to the rest of a protein • Conservation of domain-domain interactions: at SCOP Family level (red) interactions are conserved, at Fold level (blue) are not conserved. Adapted from Aloy et al, J. Mol. Biol., 2003 7
Experimental methods for identifying protein-protein interactions. • Yeast two hybrid • Mass spectroscopy • TAP purification • Gene co-expression 9
Yeast two-hybrid experiments. • Many transcription factors have two domains; one that binds to a promoter DNA sequence (BD) and another that activates transcription (AD). • Transcription factor can not activate transcription unless DNA-binding domain is physically associated with an activating domain (Fields and Song,1989) . Adapted from B. Causier, Mass Spectroscopy Reviews, 2004 10
Gal4/LacZ Y2H system • Target proteins are fused with BD and AD of GAL4 protein which activate LacZ gene. • If there is no galactose, GAL80 binds to GAL4 and blocks transcription. • If galactose is present, GAL4 can activate transcription of beta-galactosidase. Adapted from A. Traven et al, EMBO Reports, 2006 11
Development and variations of Y2H system. • Developing yeaststrains that carry several reporter genes. • Developing of haploid yeast strains of opposite mating type. Diploid cells are produced by mating of strains containing baits and preys. • One-hybrid system detects interactions between a prey protein and a known DNA sequence (bait). Adapted from B. Causier, Mass Spectroscopy Reviews, 2004 12
Development and variations of Y2H system. • RNA yeast three-hybrid system detects interactions between RNAs and proteins. • Protein yeast three-hybrid system detects the formation of complexes between several proteins. Adapted from B. Causier, Mass Spectroscopy Reviews, 2004 13
Genome-wide analysis by Y2H. • Matrix approach: a matrix of prey clones is added to the matrix of bait clones. Diploids where X and Y interact are selected based on the expression of a reporter gene. • Library approach: one bait X is screened against an entire library. Positives are selected based on their ability to grow on specific substrates. --------------------------------------------------------- Uetz et al 2000, Ito et al 2001: 692-840 interactions detected using library-based approach in yeast Adapted from B. Causier, Mass Spectroscopy Reviews, 2004 14
Drawback of Y2H. • The interactions can not be tested if a target protein can initiate transcription. • Fusion of a protein into chimeras can change the structure of a target. • Protein interactions can be different in yeast and other organisms. • It is difficult to target extracellular proteins. • Proteins which can interact in two-hybrid experiments, may never interact in a cell. 15
Advantage of Y2H. • in vivotechnique, good approximation of processes which occur in higher eukaryotes. • Transient interactions can be determined, can predict the affinity of an interaction. • Fast and efficient. 16
Mass spectroscopy. • Ionization (Ex: Electrospray ionization) produce peptide ions in a gas phase; • Detection and recording of sample ions mass-to-charge ratios are assigned to different peaks of spectra; • Analysis of MS spectra, protein identification search sequence database with mass fingerprint, find correlations between theoretical and experimental spectra. 17
Ionization. - Electrospray ionization, John Fenn, 2002) The solvent evaporates rapidly in a vacuum and peptides become ionized; - Matrix Assisted Laser Desorption, K. Tanaka, 2002) The laser ionizes protein molecules embedded on the matrix From www.nobelprize.org 18
Detection. • Peptide fragments are separated based on mass-to-charge ratios; • Accuracy of < 1 Da per unit charge; 19
Tandem affinity purification method (TAP). • Target protein ORF is fused with the DNA sequences encoding TAP tag; • tagged ORFs are expressed in yeast cells and form native complexes; • the complexes are purified by TAP method; • components of each complex are found by gel electrophoresis, MS and bioinformatics methods. 20
Tandem affinity purification method (TAP). TAP tag consists of two IgG binding domains of Staphylococcus protein A and calmodulin binding peptide; -------------------------------------- 7123 interactions can be clustered into 547 complexes (Krogan et al, 2006) O. Puig et al, Methods, 2001 21
Differences and similarities between Y2H and MS-TAP. • Both methods generate a lot of false positives, only ~50% interactions are biologically significant. • Y2H produces binary interactions, lack of information about protein complexes, but can detect transient interactions. • Y2H is in vivo technique. • MS can detect large stable complexes and networks of interactions. 22
Correlation between gene expression and protein interactions. • There should exist a relationship between gene expression levels of subunits in a complex protein-protein interactions can be verified coexpression data. • Methods are tested on protein complexes: ribosome, proteasome, RNA Polymerase II Holoenzyme and replication complexes. 23
Correlation between gene expression and protein interactions. Jansen, Greenbaum & Gerstein, Genome Research, 2002 • Expression profiles were taken from: cell cycle experiments and expression ratios for overall yeast genome for 300 cell states. • Difference between absolute expression levels can be calculated as • Difference between relative expression levels – Pearson correlation coefficient. 24
Results of gene coexpression analysis. Jansen, Greenbaum & Gerstein, Genome Research, 2002 • Subunits from the same complex show coexpression. • Expression correlation is strong for permanent complexes. • Transient complexes have weaker correlation. 25
Verification of experimental protein-protein interactions. • Protein localization method. • Expression profile reliability method. • Paralogous verification method. 26
Protein localization method. Sprinzak, Sattath, Margalit, J Mol Biol, 2003 A – A3: Y2H B: physical methods C: genetics E: immunological True positives: • Proteins which are localized in the same cellular compartment • Proteins with a common cellular role 27
Expression profile reliability method. Deane, C. M. (2002) Mol. Cell. Proteomics 1: 349-356 28
Expression profile reliability method. Deane et al, Molecular & Cellular Proteomics, 2002 EPR method is based on observation that interacting proteins are coexpressed. The distance between expression profiles of two proteins: Parameter αcharacterizes the accuracy of given data, or correspond to the fraction of false positives. 29
Paralogous verification method. PVM method is based on observation that if two proteins interact, their paralogs would interact. Calculates the number of interactions between two families of paralogous proteins. Deane, C. M. (2002) Mol. Cell. Proteomics 1: 349-356 30
Comparing large scale data of protein-protein interactions. C. Von Mering et al, Nature, 2002: • All methods except for Y2H and synthetic lethality technique are biased toward abundant proteins. • PPI are biased toward certain cellular localizations. • Evolutionarily conserved proteins have much better coverage in Y2H than the proteins restricted to a certain organism. 31
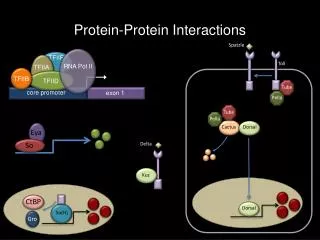
Functional organization of yeast proteome. Gavin et al, Nature, 2002 • 589 protein assemblies, • 232 multiprotein complexes, • new cellular roles for 344 proteins. 32
Functional organization of yeast proteome: network of protein complexes. • A. Gavin et al, Nature, 2002 • orthologous proteins interact with complexes enriched by orthologs; • essential gene products are more likely to interact with essential rather than nonessential proteins 33
Experiment (E) Structure detail (S) Predicted Physical (P) Functional (F) Curated (C) Homology modeling (H) *IMEx consortium Interaction databases 34
Protein interaction databases • Protein-protein interaction databases • Domain-domain interaction databases 35
DIP database • Documents protein-protein interactions from experiment • Y2H, protein microarrays, TAP/MS, PDB • 55,733 interactions between 19,053 proteins from 110 organisms. 36
DIP database Duan et al., Mol Cell Proteomics, 2002 • Assess quality • Via proteins: PVM, EPR • Via domains: DPV • Search by BLAST or identifiers / text 37
DIP database Duan et al., Mol Cell Proteomics, 2002 • Assess quality • Via proteins: PVM, EPR • Via domains: DPV • Search by BLAST or identifiers / text • Map expression data 38
DIP/LiveDIP Duan et al., Mol Cell Proteomics, 2002 • Records biological state • Post-translational modifications • Conformational changes • Cellular location 39
DIP/Prolinks database Bowers et al., Genome Biol, 2004. • Records functional association using prediction methods: • Gene neighbors • Rosetta Stone • Phylogenetic profiles • Gene clusters 40
Other functional association databases • Phydbac2 (Claverie) • Predictome (DeLisi) • ArrayProspector (Bork) 41
BIND database Alfarano et al., Nucleic Acids Res, 2005 • Records experimental interaction data • 83,517 protein-protein interactions • 204,468 total interactions • Includes small molecules, NAs, complexes 42
BIND database • Displays unique icons of functional classes 43
MPact/MIPS database Guldener et al., Nucleic Acids Res, 2006 • Records yeast protein-protein interactions • Curates interactions: • 4,300 PPI • 1,500 proteins 44
STRING database von Mering et al., Nucleic Acids Res., 2005 • Records experimental and predicted protein-protein interactions using methods: • Genomic context • High-throughput • Coexpression • Database/literature mining 45
STRING database • Graphical interface for each of the evidence types • Benchmark against Kegg pathways for rankings 46
STRING database • 736,429 proteins in 179 species • Uses COGs and homology to transfer annotation 47
More interaction databases • IntAct (Valencia) • Open source interaction database and analysis • 68,165 interactions from literature or user submissions • MINT (Cesareni) • 71,854 experimental interactions mined from literature by curators • Uses IntAct data model • BioGRID (Tyers) • 116,000 protein and genetic interactions 48
Protein interaction databases • Protein-protein interaction databases • Domain-domain interaction databases 49
InterDom database Ng et al., Nucleic Acids Res, 2003 • Predicts domain interactions (~30000) from PPIs • Data sources: • Domain fusions • PPI from DIP • Protein complexes • Literature • Scores interactions 50