Download
1 / 19
190 likes | 304 Views
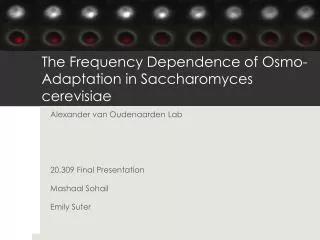
The Frequency Dependence of Osmo -Adaptation in Saccharomyces Cerevisiae. Jerome T. Mettetal et al. Science 25 January 2008. Presented by: Zeina Ali Siam & Alicia Kaestli. Overview. Presenting the biology of the Hog signaling cascade

E N D
The Frequency Dependence of Osmo-Adaptation in Saccharomyces Cerevisiae Jerome T. Mettetalet al. Science 25 January 2008 Presented by: Zeina Ali Siam & Alicia Kaestli
Overview • Presenting the biology of the Hog signaling cascade • Explaining the mathematical model used to present the signaling network • Describing the two experiments the researchers conducted to study the cascade’s feedback loop
Researchers Studied Hyperosmotic-Shock Network Why? Goal of network is to decrease net movement of water • Molecular basis of network well understood • Network has multiple feedback loops • Dominant loop is still unknown • Input (salt concentration) and output (activated Hog) are easily measured Cell Glycerol NaCl
Hyperosmotic-Shock Response System Three ways to increase intracellular concentration of glycerol High salt concentration activates of Fps-1 to reduce glycerol export P-Hog activates of Fps-1 to reduce glycerol export P-Hog induced production of glycerol synthesizing proteins Osmolyte difference Fps-1 P-Hog 2 proteins Osmolyte export Intracellular Glycerol
Salt Shocks Drive Nuclear Enrichment of Hog1 Stimulus u(t) Response R(t)
Predictive Model of Hog1 Response Created Through Fourier Analysis
The Relation Between P-Hog and Intracellular Osmolyte Concentration Can Be Represented via Differential Equations The difference in ionic concentration between the cell and its environment And is affected by negative feedback Rate of change in P-Hog Results from shock Intrcellular concentration P-Hog H: P-Hog O: Osmolyte concentration U: Osmolyte shock Rate of change in osmolyte intracellular concentration And from the amount of P-Hog The difference in ionic concentration between the cell and its environment Results from
Assessing the Importance of P-Hog Can Be Done by Comparing the Behavior of the Mutant to Wildtype Osmolyte difference Fps-1 P-Hog Osmolyte export 2 proteins Intracellular Glycerol
Mutation Within the Signaling Cascade of the Hog Cascade Can Also be Modeled Via Differential Equations No reason to change this equation Osmolytic response to H is less
Modeling the Behavior of the Mutant Relative to Wildtype Provides Biological Information [NaCl] Input: time The mathematical model accurately predicts wild type responseand mutant to osmolyte step shock. Output: Analysis: Phase shift or delay in mutant means Hog pathway controls rapid response Lower amplitude in mutant means lower maximal response
Assessing the Importance of Gene Expression When do the proteins Hog expresses become important? Osmolyte difference Yeast regulates intracellular osmolyte concentration by expressing two proteins Time for protein expression > =20 min Fps-1 P-Hog But! Yeast recovery <= 15 minutes Osmolyte export 2 proteins Intracellular Glycerol
Strategy to Study the Long Term Importanceof Gene Expression Are the proteins expressed by Hog more important in the long term than the short term? Implement periodic impulses on a ‘long’ time scale Add a chemical that inhibits protein synthesis in some cells Keep some as control Observe any changes? Yes No Proteins expressed are important Proteins expressed are not important
Proteins Expressed by P-Hog Control Cell Response in Long Term [NaCl] Input: time Normal Protein Synthesis Output: No protein Synthesis First Pulse Second Pulse Third Pulse Forth Pulse Response Time (minutes) Analysis: Gene expression feedback loop is necessary for long term response/ fluctuating environment
Conclusion & Summary Osmolyte difference 1. Hog feedback loop is necessary for maximal (through amplitude) and rapid (through phase shift) response Fps-1 P-Hog 2. Protein expression feedback loop is necessary for long term response and for severe fluctuating environments (pulses) Osmolyte export 2 proteins Intracellular Glycerol
[NaCl] time [NaCl] time [NaCl] time [NaCl] time
Osmolyte difference Fps-1 P-Hog Osmolyte export Intracellular Glycerol