Download

1 / 20
200 likes | 212 Views
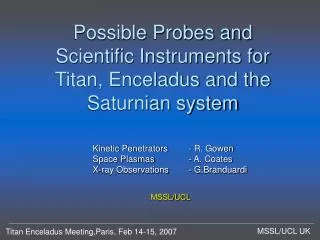
Enceladus Report. C. J. Hansen January 2013. Deriving the Structure and Composition of Enceladus’ Plume from Cassini Occultation Observations. C. J. Hansen, L. W. Esposito, J. Colwell, A. Hendrix, D. Shemansky, I. A. F. Stewart, R. A. West AGU December 2012. Gave talk at AGU.

E N D
Enceladus Report C. J. Hansen January 2013
Deriving the Structure and Composition of Enceladus’ Plume from Cassini Occultation Observations C. J. Hansen, L. W. Esposito, J. Colwell, A. Hendrix, D. Shemansky, I. A. F. Stewart, R. A. West AGU December 2012 Gave talk at AGU
2011 Dual Occultation • Eps Orionis (Alnilam, B star) • 16.5 km at closest point • HSP centered on eps Ori • Dimmer star in uv by ~2x • Zeta Orionis (Alnitak, O star) • 37.9 km at closest point
Updated Water Vapor Column Density - Dual Occ Eps Orionis I/I0 Best fit is 1.35 x 1016 cm-2 • Ratio of occulted signal to unocculted signal: I/I0 • From average of data records above FWHM • Compare to water vapor • Cross-sections from Mota, 2005 • Same as we used for 2007 zeta Orionis occ • Best fit based on minimizing the sum of the squares of the differences between the actual occ and water for a given column density, per discussion at our last team meeting Zeta Orionis I/I0 Best fit is 1.2 x 1016 cm-2
Estimate of Water Source Rate from Enceladus = 200 kg/sec S = flux (source rate) = N * x * y * vth = (n/x) * x * y * vth = n * y * vth Where N = number density / cm3 x * y = area y = vlos * t at FWHM vth = thermal velocity = 45,000 cm/sec for T = 170K (note that escape velocity = 24,000 cm/sec) n = column density measured by UVIS 2011: vlos = 7.48 km/sec y The source rate has not changed much in >6 years (deviation is <15%, not factors of 2) x v
However • There are lots of high phase angle observations designed for ISS dust jet observations • VIMS has been riding along – get integrated brightness of the plume particles • Matt Hedman has been analyzing this VIMS data • First, derived a phase function to normalize lots observations at different phase angles • Then plotted brightness as a function of orbital phase • There is an orbital dependence in the VIMS results • Brightness peaks at ~180 true anomaly (a rather narrow peak, not a sine wave)
Comparison to tidal energy model • VIMS now reporting that they see substantial brightening at high phase when Enceladus is at a true anomaly of 180 deg • Hurford et al 2007 model predicts tidally-controlled differences in eruption activity as a function of where Enceladus is in its eccentric orbit • Expect fissures to open and close • Maybe we haven’t observed an occultation at the right place??? Position of Enceladus in its orbit at times of stellar occultations, and solar occultation Taken from Hurford et al, Nature 447:292 (2007)
All Horizontal Cuts Basemap from Spitale & Porco, 2007 Zeta Ori 2011 Solar occ In all occultations we look through the plume and jets The groundtrack is the perpendicular dropped to the surface from the ray to the star Zeta Ori 2007 Blue => zeta Orionis 2007 Red => Solar occ 2010 Green => zeta Orionis 2011
Eps – Zeta Comparison • Two second integration time • Summed FUV over wavelength • Difference in altitude ~20.5 km a B c d • Zoom in on occultation time • Zeta Orionis shifted 4 sec • Should only be shifted 3.8 sec
Eps – Zeta Comparison to Dust Jets S/C • Clear signal of gas from Baghdad fissure (B), though no dust jet nearby • New Gas Jet • Damascus jets (DII and DIII): “c”, and BI detected: “d” • DIII differentiable from BI jet at 18 km, not at 40 km • Weak feature at “a” is not located at a published dust jet, but ISS and CIRS have reported enhanced activity here? a B c d
HSP - FUV No ramp h1 h2 B h7 • Geometry of groundtrack so closely paralleling the Baghdad tiger stripe means that jets are not well separated from gas release all along the fissure • Why is there more absorption in the HSP? • Level background for HSP replaced by a ramp, but still see more absorption in the HSP than in the FUV h6 h4 h5
HSP Computed ramp to use for background • Did not make much difference • Still see much more absorption in HSP than in FUV
HSP with Ramp • Computed background for HSP with ramp instead of straight line • Somewhat better match (blue compared to red) but didn’t make much difference • Why is HSP absorption more than FUV? Ramp background Straight-line background
Future Tasks • Need better water cross-sections to make progress on composition • Need ISS jet locations to make progress on jets • Need occultation at true anomaly = 1800 to look for orbit-related changes in source rate • Write CDAP for jet structure model • Write Icarus paper summarizing results from all occs
Comparison to INMS results from E7 • Highly collimated jets are consistent with INMS detection of enhanced gas streams at higher altitude • E7 INMS groundtrack at altitude of ~91 km (c/a) compared to UVIS solar occultation profile at altitude ~20 km (c/a) • INMS and UVIS both detect Alexandria and Baghdad gas jets Thanks to Ben Teolis, Brian Magee, and Hunter Waite for providing these plots, in our GRL 2011 paper
Supersonic Gas Jets and the E Ring The UVIS detection of supersonic jets compares very favorably with CDA results The full width half max (FWHM) of jet c (Baghdad I) is ~10 km at a jet intercept altitude of 29 km (z0) Estimating the mach number as ~2 z0/FWHM the gas in jet c is moving at a Mach number of 6; estimates for the other jets range from 5 to 8 Supersonic gas jets are consistent with Schmidt et al. (2008)model of nozzle-accelerated gas coming from liquid water reservoir Condensation of water molecules in the high velocity gas jets could produce small salt-poor grains (Postberg et al., 2011) detected by CDA Particle size 0.2 to 0.6 microns Compositional partitioning High velocity gas streams propel smallest particles out to become Saturn’s E ring Cassini ISS image PIA08321
What have we learned from occultations? Composition The plume is primarily composed of water vapor Upper limits have been set for CO, N2, C2H4 Source rate Flux of water is ~200 kg/sec Range is from 170 kg/sec to 220 kg/sec Suggests that Enceladus has been steadily erupting for past 7 years Enough to explain all the water products observed in the Saturn system (H, O, OH) Plume / supersonic jet structure Collimated gas jets are detected with estimated mach number of > 5 Propel small ice particles out to become Saturn’s E ring
2010 - Solar Occultation 2005 - gamma Orionis Occultation The Occultation Collection 2007 - zeta Orionis Occultation
2010 Solar Occultation Still best data set for studying individual jets High SNR Geometry gave us well-separated jets Clear separation allowed us to calculate spreading, and derive a mach number >5 Spacecraft viewed sun from this side Ingress Minimum Altitude Egress Basemap from Spitale & Porco, 2007
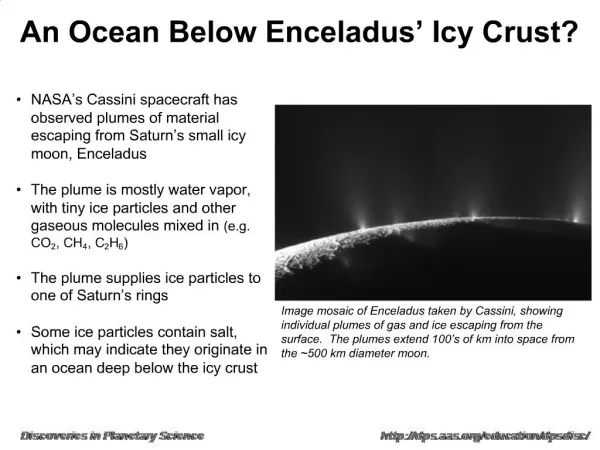
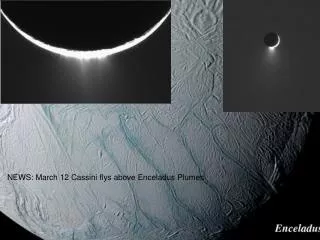
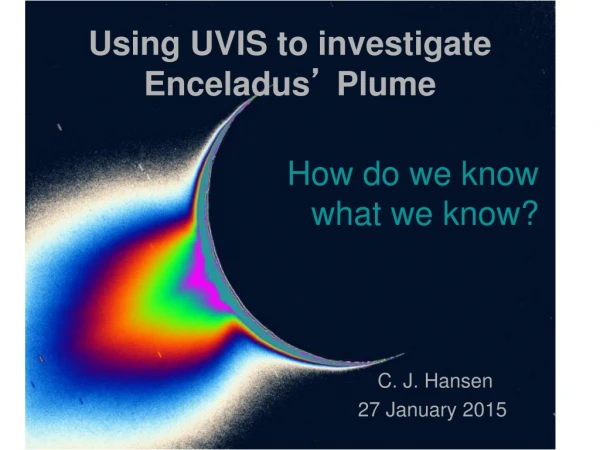
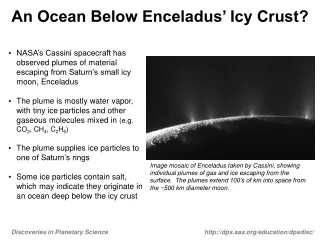
Introduction In 2005 we detected a plume of water vapor coming from Enceladus with a UVIS observation of a stellar occultation UVIS has also detected collimated gas jets within the broad plume Over the ensuing 6 years we’ve observed other occultations – but no more are planned I’ll summarize the latest (last) data in the context of the entire occultation dataset Plume Jets Shown in this Cassini ISS image are small particles – UVIS detects gas