Download
1 / 17
170 likes | 175 Views
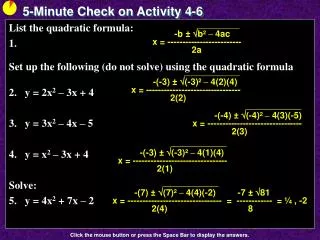
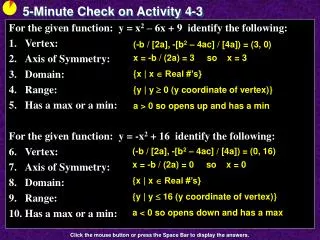
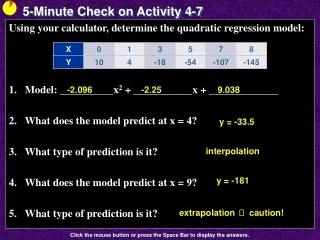
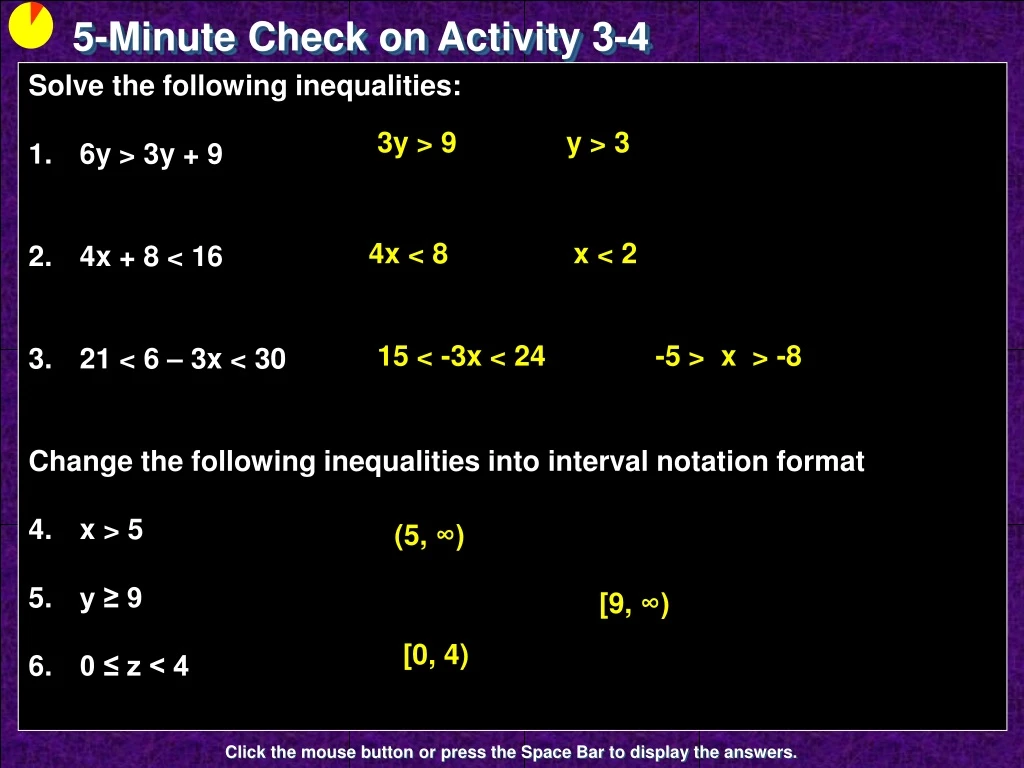
5-Minute Check on Activity 3-4. Solve the following inequalities: 6y > 3y + 9 4x + 8 < 16 21 < 6 – 3x < 30 Change the following inequalities into interval notation format x > 5 y ≥ 9 0 ≤ z < 4. 3y > 9 y > 3. 4x < 8 x < 2.

E N D
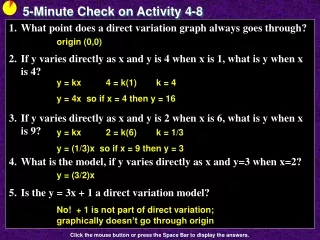
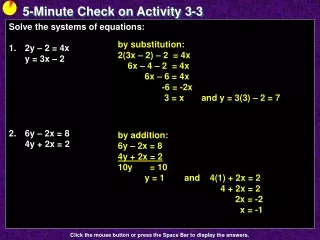
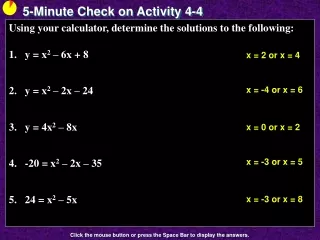
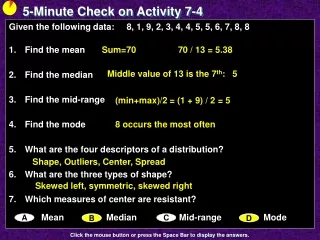
5-Minute Check on Activity 3-4 Solve the following inequalities: 6y > 3y + 9 4x + 8 < 16 21 < 6 – 3x < 30 Change the following inequalities into interval notation format x > 5 y ≥ 9 0 ≤ z < 4 3y > 9 y > 3 4x < 8 x < 2 15 < -3x < 24 -5 > x > -8 (5, ∞) [9, ∞) [0, 4) Click the mouse button or press the Space Bar to display the answers.
Activity 3 - 5 Will Trees Grow?
Objectives • Graph a linear inequality in two variables • Solve a system of linear inequalities in two variables graphically • Determine the corner points of the solution set of a system of linear inequalities
Vocabulary • Half-plane – the set of all points on one side of a line. • System of linear inequalities – two or more linear inequalities in two variables. • Corner points– the points determined by the intersection of the boundary lines of the graph of a system of linear inequalities.
Graphing Inequalities Points to Remember: • When the inequality is ≤ or ≥, then the line is included and is drawn as a solid line (equal included) • When the inequality is < or >, then the line is not included and is drawn as a dashed line (line not included) • All the area on one side of the line is feasible (meets the inequality constraint) • All the area on the other side of the line is infeasible (does not satisfy the inequality constraint) • If inequalities can be reduced to a slope-intercept form, then your calculator can help solve the problem
Inequalities – Slope-Intercept Form Inequalities written in slope-intercept form: • y < mx + b or y ≤ mx + b Below the line is a shaded region • y > mx + b or y ≥ mx + bAbove the line is a shaded region • Solution of a system of inequalities is the intersection (if any) of all solution regions (the shaded region)The intersection of the boundary lines of the shaded region is called a corner point
If All Else Fails …. • Remember, we can plug in a point, above or below the line, and see if it satisfies the inequality. If it works, then that side of the line is shaded; and if it doesn’t work, then the other side of the line is shaded.
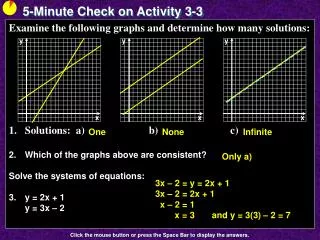
y y y Graphical Method – Solutions Space • ConsistentInconsistent (Parallel Lines)Solution Space No Solution Solution Space x x x
TI-84 Help • Change inequalities to an equal sign and solve for y (y = mx + b format) • Place equations into Y1 and Y2 • The shade regions below:Press Y= and move cursor to the extreme leftPress ENTER as many times as necessary to change the icon to • The shade regions above:Press Y= and move cursor to the extreme leftPress ENTER as many times as necessary to change the icon to • Solution Space is the cross-hatched region
Will Trees Grow? While researching a term paper on global climate change, you discover a mathematical model that gives the relationship between temperature and amount of precipitation that is necessary for trees to grow. If t represents the average annual temperature in °F, and p represents the annual precipitation in inches, then t ≥ 35 5t - 7p < 70 These inequalities form a system of inequalities in two variables. The solution of the system is the set of all ordered pairs in the form (t, p) that make each of the inequalities in the system a true statement.
Will Trees Grow? t ≥ 35 5t - 7p < 70 • Will trees grow in a region in which the average temperature is 22°F and the annual precipitation is 30 inches? • Will trees grow if the average temperature is 55°F and the annual precipitation is 20 inches? • In Sydney Australia, the average temperature is 64°F and the annual precipitation is 48 inches. Will trees grow in Sydney? No; average temperature must be above 35 No; 5(55) – 7(20) = 135 which is greater than 70 Yes; 64 is greater than 35 and 5(64) – 7(48) = -16 which is less than 70
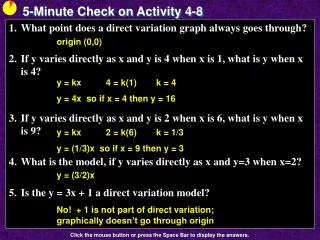
t Graphing the Solution Space • t ≥ 35 • 5t – 7p < 70 5t < 7p + 70 t < (7/5)p + 14 p Solution Space Meets TemperatureConstraint 35 Meets Temperature and Precipitation Constraint 15
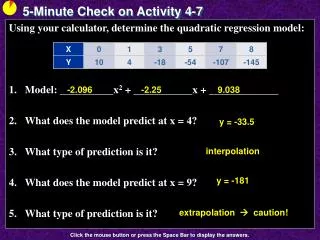
t Where do Trees Grow? • Fill in the following table to see if trees can grow there (without man’s help) p Solution Space Meets TemperatureConstraint 35 Meets Temperature and Precipitation Constraint No No No No 15
Steps to Solve Systems of Inequalities Given: Two Inequalities Step 1: Solve for y • Bring x terms to other side • Divide through by constant in front of y • Remember to switch inequality if dividing by a negative number Step 2: Enter “equations” into calculator • Change icons on far left Step 3: Graph with an appropriate window • Solution space is cross-hatched region
y x Example Problem 1 Given: 4x – 2y ≥ 8 2x + 3y < 6 • Step 1: - 2y ≥ 8 – 4x 3y < 6 – 2xy ≤ -4 + 2x y < 2 – (2/3)x • Step 2: Y1 = 2X – 4 Y2 = - (2/3)X + 2 • Step 3: Graph (seen below) NoteY1is a solid line and Y2 is a dashed line
y x Example Problem 2 Given: 3x + 2y ≥ 16 x – 2y ≤ 0 • Step 1: 2y ≥ 16 – 3x -2y ≤ 0 – xy ≥ 8 – (3/2)x y ≥ 0 + (1/2)x • Step 2: Y1 = -(3/2)X + 8 Y2 = (1/2)X + 0 • Step 3: Graph (seen below) NoteY1is a solid line and Y2 is a solid line
Summary and Homework • Summary • An inequality of the form Ax + By < C, where A and B cannot both equal zero, is called a linear inequality in two variables. The symbol < can be replaced by >, ≤ or ≥. • The solution set of a linear inequality in two variables x and y is the collection of all ordered pairs (x, y) whose coordinates satisfy the given inequality. • The solution set of a system of linear inequalities in two variables is the collection of all ordered pairs whose coordinates satisfy each linear inequality in the system. • Homework • pg 346-352; 1, 5-7, 11, 13