Download
1 / 34
350 likes | 375 Views
Chapter 12 Visual Representation of Data. Learning Objectives. Understand the role of visuals in technical communication Determine when to use visuals Select the right visuals for your readers Create tables, graphs, charts, illustrations, photographs, and videos

E N D
Learning Objectives • Understand the role of visuals in technical communication • Determine when to use visuals • Select the right visuals for your readers • Create tables, graphs, charts, illustrations, photographs, and videos • Increase visual appeal by using color appropriately
Learning Objectives (continued) • Identify ethical issues when using visuals • Understand how cultural considerations affect your choice of visuals
Visuals • Because they focus and organize information, visuals make data easier to interpret and remember. • By offering new ways of looking at data, visuals reveal meanings that might otherwise remain buried in lists of facts and figures. • Readers want more than just raw information; they want this material shaped and enhanced so they can understand the message at a glance.
Why Visuals Matter Visuals help us to answer questions like: • Which information is most important? • Where, exactly, should I focus? • What do these numbers mean? • What should I be thinking or doing? • What should I remember about this? • What does it look like? • How is it organized? • How is it done? • How does it work?
When to Use Visuals • Use visuals whenever they can make your point more clearly than text or when they can enhance your text. • Use visuals to clarify and support your discussion, not just to decorate your document. • Use visuals to direct the audience’s focus or help them remember something.
Types of Visuals Visuals come in four categories: tables, graphs, charts, and graphic illustrations. • Tables: Display organized data across columns and rows for easy comparison. • Graphs: Translate numbers into shapes, shades, and patterns. • Charts: Depict relationships via geometric, arrows, lines, and other design elements. • Graphic Illustrations: Rely on pictures rather than on data or words.
How to Choose the Right Visuals To select the most effective display, answer these questions: • What is the purpose for using this visual: Do I want to show facts and figures? Show parts of a mechanism? Give directions? Show relationships? • Who is my audience for these visuals: Is it an expert audience? A general audience? A global audience? • What form of information will best achieve my purpose for this audience: Is my message best conveyed by numbers? Words? Shapes? Pictures? Symbols?
Tables Tables display dense textual information such as specifications or comparisons. 1. Numerical tables present quantitative information(data that can be measured). 2. Prose tables present qualitative information (prose descriptions, explanations, or instructions).
Graphs • Graphs translate numbers into shapes, shades, and patterns. They display, at a glance, the approximate values, the point being made about those values, and the relationship being emphasized. • Graphs are especially useful for depicting comparisons, changes over time, patterns, or trends.
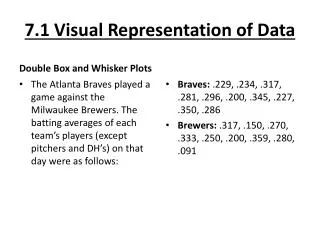
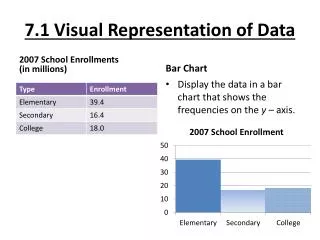
Graphs (continued) 1. Bar graphs: Show discrete comparisons, such as year-by-year or month-by-month. • A simple bar graph displays one trend or theme. A multiple bar graph displays two or three relationships simultaneously.
Graphs (continued) • A horizontal-bar graph is good for displaying a large series of bars arranged in order of increasing or decreasing value.
Graphs (continued) • A stacked bar graph shows how much each data set contributes to the whole.
Graphs (continued) • A 100 Percent bar graph shows the value of each part that makes up the 100 percent value.
Graphs (continued) • A 3D bar graph shows a three-dimensional view.
Graphs (continued) 2. Line graphs: Help readers synthesize large bodies of information in which exact quantities don’t need to be emphasized. • A simple line graph plots time intervals (or categories) on the horizontal scale and values on the vertical scale. A multiline graph displays several relationships simultaneously.
Graphs (continued) • A deviation line graph extends the vertical scale below the zero baseline to display positive and negative values in one graph.
Graphs (continued) • A simple band or area graph shades in the area beneath the main plot lines to highlight specific information.
Graphs (continued) • A multiple band graph depicts relationships among sums instead of the direct comparisons.
Charts • The terms chart and graph often are used interchangeably. • However, charts, unlike graphs, display relationships (quantitative or cause-and-effect) that are not plotted on a coordinate system (x and y axes).
Charts (continued) 1. Pie charts: Display the relationship of parts or percentages to the whole. • A simple pie chart simply shows the relationship of parts to the whole. An exploded pie chart highlights various slices:
Charts (continued) 2. Organization charts: Show the hierarchy and relationships between different departments and other units in an organization.
Charts (continued) 3. Flowcharts: Trace procedures or processes from beginning to end. 4. Tree charts: Show how the parts of an idea or concept are related.
Charts (continued) 5. Gantt charts: Depict how the parts of an idea or concept relate. A series of bars or lines (time lines) indicates start-up and completion dates for each phase or task in a project. 6. PERT charts: Use shapes and arrows to outline a project’s main activities and events.
Charts (continued) 7. Pictograms: Display numerical data by plotting it across x and y axes, and use icons, symbols, or other graphic devices.
Graphic Illustrations • Illustrations can be diagrams, maps, drawings, icons, photographs, or any other visual that relies mainly on pictures rather than on data or words. • Avoid using illustrations simply to decorate the page. Each illustration you use should serve a specific purpose.
Graphic Illustrations (continued) 1. Diagrams: Illustrate how things work or fit together by altering their real appearance. • An exploded diagram shows how the parts of an item are assembled. A cutaway diagram shows the item with its exterior layers removed to reveal interior sections. Ablock diagram represents the relationship between the parts of an item, principle, system, or process.
Graphic Illustrations (continued) 2. Maps: Are especially useful for showing comparisons and for helping users visualize position, location, and relationships among various data.
Graphic Illustrations (continued) 3. Photographs: Are especially useful for showing exactly how something looks or how something is done. 4. Videos: Are particularly useful to show how to do something from start to beginning. 5. Symbols and Icons: Can convey information visually to a wide range of audiences.
Using Colors Consider using color not only in your visuals, but also within the text of a document in order to: • Organize textual material (color rules and color background) • Orient readers (color headings, tabs, boxes, and sidebars) • Emphasize information (color key words, cross references, Web links, and text borders)
Ethical Considerations Because visuals are easy to manipulate, be especially careful about using visuals ethically. • Present the real picture. Visual relationships in a graph should accurately portray the numerical relationships they represent. Do not distort sizes, angles, lengths, widths, or anything else to mislead the viewer. • Present the complete picture. An accurate visual should include all essential data, without selectively omitting important data.
Cultural Considerations • Visual communication can serve as a universal language—as long as the graphic or image is not misinterpreted. • The use of color is an especially important cultural consideration: For instance, U.S. audiences associate red with danger and green with safety. But these colors represent different things in other cultures.
Review Questions 1. Why is using visuals in technical communication important? 2. When should you use visuals? 3. What are the four categories of visuals, and what does each do? 4. What three questions should you ask yourself when you are deciding which type of visual to use? 5. What are the two types of tables, and what kind of information does each type present?
Review Questions (continued) 6. What are the two most common types of bar graphs, and what is the function of each type? 7. What are the two most common types of line graphs, and what is the function of each type? 8. What are the two types of pie charts, and what is the function of each type? 9. What are the three most common types of diagrams, and what do they show? 10. In what ways does color enhance any technical document?