Download
1 / 1
10 likes | 125 Views
Figure 1 : NO x /O 3 schematic In the presence of VOCs (From Atkinson, 2000). Coke Plant. U.S. Pipe. Smelter. Performance. Target Compounds. ECIP-FTIR Objectives. Flow Diagram.

E N D
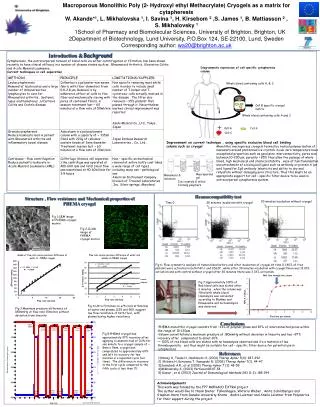
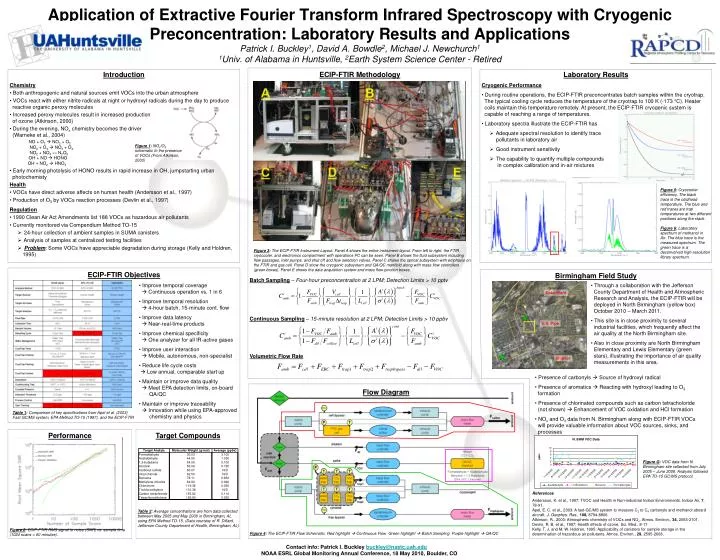
Figure 1:NOx/O3 schematic In the presence of VOCs (From Atkinson, 2000) Coke Plant U.S. Pipe Smelter Performance Target Compounds ECIP-FTIR Objectives Flow Diagram Figure 4: The ECIP-FTIR Flow Schematic. Red highlight Continuous Flow Green highlight Batch Sampling Purple highlight QA/QC Application of Extractive Fourier Transform Infrared Spectroscopy with Cryogenic Preconcentration: Laboratory Results and ApplicationsPatrick I. Buckley1, David A. Bowdle2, Michael J. Newchurch11Univ. of Alabama in Huntsville, 2Earth System Science Center - Retired • Introduction • Chemistry • Both anthropogenic and natural sources emit VOCs into the urban atmosphere • VOCs react with either nitrite radicals at night or hydroxyl radicals during the day to produce reactive organic peroxy molecules • Increased peroxy molecules result in increased production of ozone (Atkinson, 2000) • During the evening, NOx chemistry becomes the driver (Warneke et al., 2004)NO + O3 NO2 + O2NO2 + O3 NO3 + O2NO2 + NO3↔ N2O5OH + NO HONO OH + NO2 HNO3 • Early morning photolysis of HONO results in rapid increase in OH, jumpstarting urban photochemisty • Health • VOCs have direct adverse affects on human health (Andersson et al., 1997) • Production of O3 by VOCs reaction processes (Devlin et al., 1997) • Regulation • 1990 Clean Air Act Amendments list 188 VOCs as hazardous air pollutants • Currently monitored via Compendium Method TO-15 • 24-hour collection of ambient samples in SUMA canisters • Analysis of samples at centralized testing facilities • Problem: Some VOCs have appreciable degradation during storage (Kelly and Holdren, 1995) ECIP-FTIR Methodology • Laboratory Results • Cryogenic Performance • During routine operations, the ECIP-FTIR preconcentrates batch samples within the cryotrap. The typical cooling cycle reduces the temperature of the cryotrap to 100 K (-173 °C). Heater coils maintain this temperature remotely. At present, the ECIP-FTIR cryogenic system is capable of reaching a range of temperatures. • Laboratory spectra illustrate the ECIP-FTIR has • Adequate spectral resolution to identify trace pollutants in laboratory air • Good instrument sensitivity • The capability to quantify multiple compounds in complex calibration and in-air mixtures Figure 5: Cryocoolerefficiency. The blacktrace is the coldheadtemperature. The blue and red traces are trap temperatures at two differentpositions along the stack. Figure 6: Laboratory spectrum of methanol in Air. The blue trace is the measured spectrum. Thegreen trace is a deconvolved high-resolutionlibrary spectrum. Figure 3: The ECIP-FTIR Instrument Layout. Panel A shows the entire instrument layout. From left to right, the FTIR, cryocooler, and electronics compartment with operations PC can be seen. Panel B shows the fluid subsystem including flow passages, inlet pumps, and shut off and flow selection valves. Panel C shows the optical subsystem with emphasis on the FTIR and gas cell. Panel D show the cryogenic subsystem and QA/QC manifold along with mass flow controllers (green boxes). Panel E shows the data acquisition system and mass flow junction boxes. Birmingham Field Study Batch Sampling– Four-hour preconcentration at 2 LPM; Detection Limits > 10 pptv • Improve temporal coverage Continuous operation vs. 1 in 6 • Improve temporal resolution 4-hour batch, 15-minute cont. flow • Improve data latency Near-real-time products • Improve chemical specificity One analyzer for all IR-active gases • Improve user interaction Mobile, autonomous, non-specialist • Reduce life cycle costs Low annual, comparable start up • Maintain or improve data quality Meet EPA detection limits, on-board QA/QC • Maintain or improve traceability Innovation while using EPA-approved chemistry and physics • Through a collaboration with the Jefferson County Department of Health and Atmospheric Research and Analysis, the ECIP-FTIR will be deployed in North Birmingham (yellow box) October 2010 – March 2011. • This site is in close proximity to several industrial facilities, which frequently affect the air quality at the North Birmingham site. • Also in close proximity are North Birmingham Elementary and Lewis Elementary (green stars), illustrating the importance of air quality measurements in this area. Continuous Sampling– 15-minute resolution at 2 LPM; Detection Limits > 10 ppbv Volumetric Flow Rate • Presence of carbonyls Source of hydroxyl radical • Presence of aromatics Reacting with hydroxyl leading to O3formation • Presence of chlorinated compounds such as carbon tetracholoride (not shown) Enhancement of VOC oxidation and HCl formation • NOx and O3 data from N. Birmingham along with ECIP-FTIR VOCs will provide valuable information about VOC sources, sinks, and processes Table 1: Comparison of key specifications from Apel et al. (2003) Fast GC/MS system, EPA Method TO-15 (1997), and the ECIP-FTIR Figure G: VOC data from N. Birmingham site collected from July 2005 – June 2006. Analysis followedEPA TO-15 GC/MS protocol. References Andersson, K. et al., 1997: TVOC and Health in Non-industrial Indoor Environments. Indoor Air, 7, 78-91.Apel, E. C. et al., 2003: A fast-GC/MS system to measure C2 to C4 carbonyls and methanol aboard aircraft. J. Geophys. Res., 108, 8794-8806.Atkinson, R., 2000: Atmospheric chemistry of VOCs and NOx. Atmos. Environ., 34, 2063-2101.Devlin, R. B. et al., 1997: Health effects of ozone. Sci. Med., 8-17.Kelly, T. J. and M. W. Holdren, 1995: Applicability of canisters for sample storage in the determination of hazardous air pollutants. Atmos. Environ., 29, 2595-2608. Table 2: Average concentrations are from data collected between May 2005 and May 2006 in Birmingham, AL using EPA Method TO-15. (Data courtesy of R. Dillard, Jefferson County Department of Health, Birmingham, AL) Figure 2: ECIP-FTIR RMS signal to noise (SNR) vs. sample time (1024 scans = 60 minutes). Contact info: Patrick I. Buckley buckley@nsstc.uah.edu NOAA ESRL Global Monitoring Annual Conference, 18 May 2010, Boulder, CO