Download
1 / 29
300 likes | 607 Views
Multivariate Decision Trees for the Interrogation of Bioprocess Data. Kathryn Kipling Centre for Process Analytics and Control Technology School of Chemical Engineering and Advanced Materials University of Newcastle upon Tyne, England. Overview of Presentation.

E N D
Multivariate Decision Trees for the Interrogation of Bioprocess Data Kathryn Kipling Centre for Process Analytics and Control Technology School of Chemical Engineering and Advanced Materials University of Newcastle upon Tyne, England
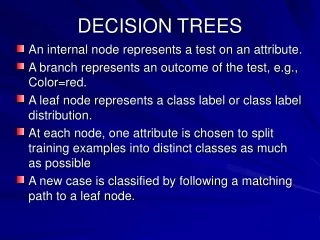
Overview of Presentation • Introduction to decision trees. • Problems with the decision tree approach. • Multivariate decision trees. • Application to bioprocess data. • Conclusions.
Introduction to Decision Trees • Rule induction aims to find compact rules that describe a data set well. • Decision trees and rule induction are two similar techniques but rule induction produces text rules while decision trees form hierarchical trees that can be converted into rules. • The data set is said to comprise several attributes that are used to predict the outcome variable. • The outcome could be quality and the attributes the MDX flow at 80 log hours, the rate of change of temperature, the pH value at 75 log hours for example.
Introduction to Decision Trees • There are three basic techniques used in decision tree learning • Divide and conquer where the data set is divided into subsets. • The covering approach finds groups of attributes uniquely shared by examples in given classes and removes correctly classified examples before finding rules relating to the remaining examples. • Inductive logic programming uses propositional and predicate logic to form rules.
Introduction to Decision Trees • Consider a data set of 3 attributes and one outcome. • Using some measure of influence, calculate the relative importance of one variable over another with respect to the outcome. • This can be difficult with continuous data so it is usual that the data is divided into classes. • For situations where the data is continuous it can be split into two parts (>= value A and < value A) by calculating the contribution of each value of a variable to the outcome.
Introduction to Decision Trees Tree Algorithms • Decision tree algorithms, such as ID3 and CART, are based on the use of a metric that is quantified in terms of the information provided by a single attribute conditional on information from other attributes. • The choice of information measure depends on the data type that is being used and the application of the algorithm.
Introduction to Decision Trees Tree Algorithms • Information measures include entropy, Chi-squared test, the F-test or the G-statistic. • Each measure essentially carries out the same task but the values change and the relevance of the numbers is different. • The most relevant attribute to the outcome is chosen using the information measure. • This attribute is divided according to the classes of that attribute and the process continues until there are no attributes left to consider or no more samples to consider.
Problems with the Decision Tree Approach • The discovered knowledge is represented at a single level of detail and is not always suitable for human understanding since many variables are combined to make a decision. • No account is taken of correlated variables. • The program takes no account of the meaning of the data thus spurious correlations are possible. With any statistical technique this is difficult to avoid and careful pre-processing is required. • The traditional algorithm cannot generate fuzzy rules or deal with uncertain data. • If a data set has a large number of possible outcomes then a small change in the data can have a major influence on the algorithm.
Explained data DATA SET Generated rules Window of data Unexplained data Problems with the Decision Tree Approach • To deal with large data sets and large numbers of output values a window of the data is used, the algorithm applied to this and the generated rules compared to the rest of the data set. Those instances that are not explained by the rules are considered in a new data set and the process repeated until all the data is explained.
Multivariate Decision Trees • The idea for the multivariate decision tree is based on the problem of dealing with many variables that are correlated. • It is common to use many variables in the decision making process but the decision tree approach does not deal well with this issue. • It is proposed that a multivariate technique is applied to the data to eliminate this difficulty.
Multivariate Decision Trees • There is other research into multivariate decision trees. • Many consider the problem of a multivariate response although there is work that considers the use of multivariate splits at the nodes. • This generally uses some linear combination of the variables and there are many methods that have been considered to calculate the split point. • These include linear discriminant, hill climbing methods, perceptron learning, neural networks and simulated annealing. • Combinations of variables have been considered but the concept of removing interactions between variables is less well understood in the literature.
Multivariate Decision Trees • The approach described here uses the principal components of the data set as the inputs to the tree algorithm. • The principal component pre-processing creates orthogonal parameters removing the correlation between the input variables. • The concept involves three main stages: • Pre-processing the data to remove outliers and deal with missing variables. • Application of principal components analysis to the cleaned data set. • Application of the decision tree algorithm to the principal components.
Multivariate Decision Trees • The output of a principal components analysis is the scores and the loadings. • The scores are the values used in the decision tree analysis but the loadings are required for the interpretation of the information. • The loadings provide information regarding the relative value of original variable and how this relates to the outcome of the decision tree.
Multivariate Decision Trees • Initially the concept was applied to the iris data set. This set comprises 150 samples of 4 variables and one outcome. • The graph shows how these variables change and the vertical lines indicate the changes in the outcome (iris type)
Application to the Iris Data Set • When the univariate approach is used this tree is obtained. • Considering the correlation coefficients, it can be seen that there are relationships between the variables. • These are not accounted for in the univariate decision trees.
Using the PCA scores as the inputs to the program the following tree is obtained. To interpret this the loadings plot is also needed. Application to the Iris Data Set
Application to the Iris Data Set • Considering the charts on the previous slide: • If the petal length, petal width and sepal length are smaller then the iris is a setosa. • If these values are larger then the iris is a virginica. • Those that fall in between are more likely to be Iris versicolor. • Although the univariate decision tree is capable of picking out these elements, the combination of these variables may prove to be important. • The technique is interpretable on a well understood data set and know must be tested on other sets of data.
Application to Bioprocess Data • The bioprocess data comprises data from two stages. • Stage 1 – Realise an increase in the biomass of the culture. • Stage 2 - The biomass is encouraged to form the product. • For the two stages the data set comprised 43 batches and 40 variables. • The data set was composed of point values such as maxima, minima and event times and rates of change in the variables.
Application to Bioprocess Data • Using the number of principal components to measure the correlation, Stage 1 requires 70% of the possible principal components to describe the variation while Stage 2 required 57%. • This implies that there is greater correlation between the variables in Stage 2 than in Stage 1.
Application to Bioprocess Data • For principal component five, the root node, variables with larger loadings include 3, 8, 9 and 12 with variable 8 dominant. Hence batches where variable 8 is lower have a higher probability of being good. • It is the relationship between these variables that is important. • Considering the other loadings plots and the tree we can gain a greater insight into the relationships that exist and their relevance to the process.
Application to Bioprocess Data • This tree is for stage 2 of the process.
Application to Bioprocess Data • Considering the plots, the dominant variables in PC1 are 22, 23, 24, 25 and 26. • For the batch to be good, all of these variables must be smaller. If variable 23 is a time then the event must occur earlier for the batch to be good.
Testing the Trees • The trees developed were tested using an unseen data set comprising 18 batches and 40 variables.
Testing the Trees • It would be expected that the Stage 1 data would have a weaker relationship to the final outcome than the Stage 2 data. • This does not seem to be the case since the Stage 2 tree performs poorly with the unseen data. • The use of the principal components does significantly improve the performance.
Conclusions • This paper presented an investigation into the possibility of using a multivariate approach to decision tree analysis. • The technique allows several variables to be considered simultaneously since it is the interaction between the variables that is of interest. • Interpretable trees can be produced using the principal components. • However, the principal components are produced with no regard for the relationship between the input variables and the product quality.
Future Work • Using the latent variables from a partial least squares approach it is hoped that an investigation into the relationship between the input and output can be established. • This method would use the latent variables as input to the decision tree program in the same way as the principal components are used in this study. • It is hoped that this will provide a better insight into the production levels of the bioprocess.
Acknowledgements • GSK Worthing • Paul Jeffkins, Sarah Stimpson. • EPSRC KNOW-HOW (GR/R19366/01) for financial support. • Centre for Process Analytics and Control Technology. • Professors Gary Montague, Julian Morris and Elaine Martin