Download
1 / 39
390 likes | 394 Views
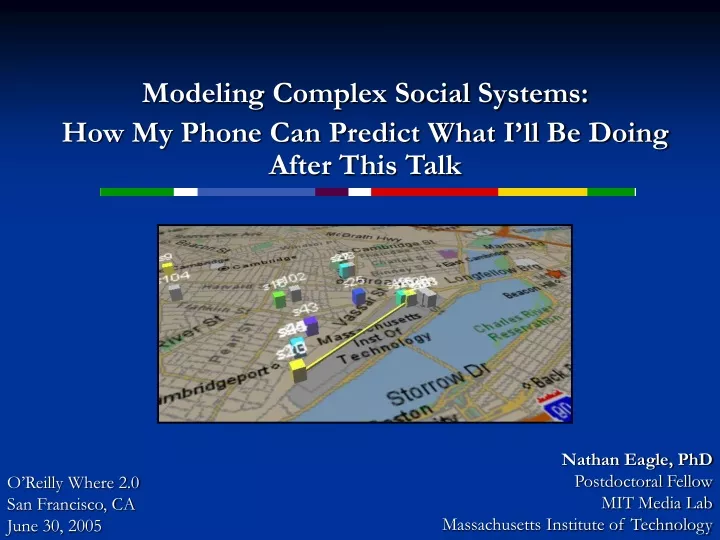
Modeling Complex Social Systems: How My Phone Can Predict What I’ll Be Doing After This Talk. Nathan Eagle, PhD Postdoctoral Fellow MIT Media Lab Massachusetts Institute of Technology. O’Reilly Where 2.0 San Francisco, CA June 30, 2005. Reality Mining: Complex Social Systems.

E N D
Modeling Complex Social Systems: How My Phone Can Predict What I’ll Be Doing After This Talk Nathan Eagle, PhD Postdoctoral Fellow MIT Media Lab Massachusetts Institute of Technology O’Reilly Where 2.0 San Francisco, CA June 30, 2005
Reality Mining Data • 100 Nokia 6600s with Context logging software • Location: Celltower ID / User-Defined Names date, area, cell, network, name • Bluetooth: Proximate Bluetooth Devices every 5 minutes date, MAC, device name, device type • Communication: Phone Call/Text Log date, text/call, incoming/outgoing, duration, number • Total Data • Over 450,000 hours continuous human behavior data collected over the 2004-2005 academic year. Raento, M., Oulasvirta, A., Petit, R., Toivonen, H., "ContextPhone – A prototyping platform for context-aware mobile applications". IEEE Pervasive Computer. To appear: April 2005.
High-Level Situation Classification • Probabilistic Graphical Models for Data Filtering • Conditioned HMM
The Entropy of Life • Shannon Information Entropy Applied to Everyday Life • Estimate of the amount of structure / randomness in a subject’s routine. Low Entropy Subject, I1 High Entropy Subject, I2
Behavioral Entropy • Which demographic is the most entropic?
Eigenbehaviors: Transformation IndividualBehavior Space Turk, M., and Pentland, A., "Eigenfaces for Recognition", J. of Cognitive Neuroscience. Vol 3, Number 1., (1991) 71-86
Eigenbehaviors: Behavior Space • Daily human behavior can be clustered in a low dimensional space.
Eigenbehaviors: Affiliation Inference Group j Behavior Space • Can we determine a subject’s affiliation based on short samples of behavior?
Aggregate Usage Statistics • Voice is the dominate mode of communication • Applications such as the ‘clock’ are used more at home • Media Lab students snooze more than Sloan students (2.4 times/day vs. .6 times/day
One Day in the Life... • Automatic Diary Generation: • A life log from cell tower IDs
Life Query • AutoDiary • How much sleep did I get last week? • When was the last time I had lunch with Josh? • How much time did I spend driving when I was last in Mountain View? • Where did I go after leaving Marvin’s house last week? • Prediction • What are the chances of seeing Mike in the next hour? • How likely is it that Caroline will call me tonight? • Will I be in lab this weekend?
Friendship vs. Proximity Networks Self-Report Friendship 1-Day Proximity
Relationship Inference • Is it possible to infer friendship based on proximity behavior? FRIEND ACQUAINTANCE
Dyad Statistics for the Media Lab Subjects Nathan Eagle and A. Pentland, “Reality Mining: Sensing Complex Social Systems”, Journal of Personal and Ubiquitous Computing, To appear: June 2005.
Frequency of Intra-Group Connections • Different Groups = Different Dynamics? Responsive Environments Group Human Dynamics Group
Proximity Persistence • Network Edge Persistence • Tail can be indicative of organization’s state
Organizational Rhythms 24 hrs 168 hrs (7 days) • How the deadlines of an institution can be seen in the collective behavior of its individual members.
BlueDar: Bluetooth Radar • Currently Deployed around MIT • Infinite Corridor, Media Lab, Muddy Charles Pub, Sloan Business School, Student Center, … • Coming Soon... • Cafeterias • Elevators • Gym • ... Nathan Eagle, “Can Serendipity Be Planned?”, MIT Sloan Management Review, Vol. 46, No. 1, pp 10-14, 2004.
MetroSpark Nathan Eagle and A. Pentland, “Mobile Matchmaking: Proximity Sensing and Cuing”, IEEE Pervasive Computing, 4 (2): 28-34, 2005. Nathan Eagle and Alex Pentland, "Combined short range radio network and cellular telephone network for interpersonal communications." U.S. Patent Application Serial No. 60/568,482. Filed May 6, 2004. MIT ID: 10705T. Assignee: Massachusetts Institute of Technology.
Conclusions • There is no universal equation for social behavior – rather, understanding will constructed by an accumulation of examples. • The Importance of Improved Understanding • Applications that better support the individual and group • Informed design of organizations, schools, cities, office buildings in such a way that conforms with how we actually behave - and enhances and encourages beneficial social interactions • This is only the beginning…
Acknowledgements Advisor - Alex (Sandy) P. Pentland Collaborators – Caroline Buckee, Aaron Clauset, Leon Dannon, Stephen Guerin, Max Van Kleek, Mike Lambert, David Lazer, Bo Morgan, Tony Pryor, Martin Martin, Lauren Oldja, Mika Raento, Push Singh, Greg Sterndale, Sanith Wijesinghe, Pedro Yip Nokia - Harri Pennanen, Hartti Suomela, Saku Hieta, Peter Wakim, Franklin Reynolds, Suvi Hiltunen, Timo Salomaki
Questions? Nathan Eagle, PhD Postdoctoral Fellow MIT Media Lab Massachusetts Institute of Technology nathan@media.mit.edu http://reality.media.mit.edu
Participants & Total Data • 100 Participants • Media Lab Freshman (6) • Media Lab UROPs (5) • Media Lab Incoming Grad Students (15) • Media Lab Senior Grad Students (40) • Media Lab Faculty (3) • Media Lab Staff (6) • Sloan Business School Incoming Students (25) • Total Data • Over 450,000 hours continuous human behavior data collected over the 2004-2005 academic year.
Behavior Prediction and Reconstruction • Most subject behavior can be represented with a single eigenbehavior • Prediction is possible • Unlikely behavior becomes easy to flag
Life Inferences Applications: IndividualsLocation · Bluetooth · Communication • Class: Sleeping? • Location: {Home} • Phone status: {idle/charging} • Time: {late night / early morning} • Alarm Clock: {interval} • Class: Lunch? • Location: {!= office} • People: {lunch crowd={Mike, Push, Martin}} • Time: {lunchtime} • Class: Partying? • Location: {hang outs ={b-side, sevens, BHP}} • People: {party friends={Mike, Jon, Aisling}} • Time: {evening / late night}
Self-Report vs. Bluetooth Statistics Applications: IndividualsLocation ·Bluetooth· Communication • How accurately do students respond to social network surveys?
Satisfaction with Research Group Applications: GroupsLocation ·Bluetooth· Communication • How is proximity to friends correlated with satisfaction with one’s research group?
Autocorrelation on Separation Time • How correlated is a particular network over time?
Frequency of Intra-Group Connections Responsive Environments Group Human Dynamics Group • Different Groups = Different Dynamics?
Cell Tower IDs + Bluetooth Localization Localization – Office Resolution BT vs. Cell Tower
Data Validation & Characterization • Data Validation • Daily Experience Diaries • Surveys • Bluetooth Studies • Missing Data = ~ 15% • Data Corruption • Application Crashes • Bluetooth Errors • Subject-Induced
Sampling Rate vs. Network Dynamics • How do group behavior dynamics get ‘washed out’ from sampling? Clustering Coefficient, C Network Correlation, Mean Degree,
Sampling Rate vs. Network Metrics • Structural measures increase monotonically with increasing sampling period
Network Evolution • Can mobile phone usage reflect an emphasis on ‘networking’ and social network evolution?