Download
1 / 32
320 likes | 428 Views
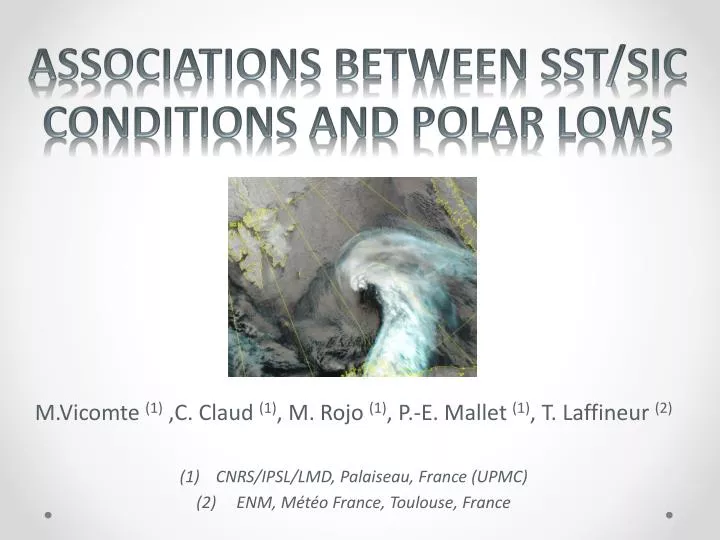
Associations between SST/SIC conditions and polar lows. M.Vicomte (1) ,C . Claud (1) , M. Rojo ( 1) , P.-E. Mallet (1) , T. Laffineur (2) CNRS/IPSL/LMD , Palaiseau, France (UPMC) ENM, Météo France, Toulouse, France. Characteristics Of Polar Lows ( PLs ).

E N D
Associations between SST/SIC conditions and polar lows M.Vicomte(1) ,C. Claud(1), M. Rojo(1), P.-E. Mallet (1), T. Laffineur(2) CNRS/IPSL/LMD, Palaiseau, France (UPMC) ENM, Météo France, Toulouse, France
Characteristics Of Polar Lows (PLs) Very intense mesoscale storms < 1 000 km diameter, generally < 24 h lifetime --> difficult to forecast. A maritime phenomenon, declining rapidly over land (because of the larger fluxes of heat and moisture from the ocean). Usually occur during winter season, between October and March Formation requires a cold air outbreak over relatively warm water Mean winds in excess of 25m/s, strong precipitation. Polar Low (PL) 28 Oct 2008 02:08 UTC Image AVHRR NOAA 18 (http://www.sat.dundee.ac.uk/)
Objectives Within WP1 coretheme, our goal is : to betterunderstand the role of the SST and seaice conditions on the spatial and temporal distribution of polar Lows
Characteristics Of Polar Lows Formation areas of polar lows Focus on Norwegian and Barents Seas(Noer et al., 2011) October November December January February March • Large interannualvariability : • Few PL in October ≤ 2 per year • Much more in March with a maximum of 13 PLs in 2013
Representation of Polar Lows in Reanalyses • Representation of PLs in reanalysescompared to observations between 1999 and 2001 : • ERA-40 (1.125° resolution) : 24% • ERA-I (0.75° resolution) : 45 % (Laffineur et al., MonthlyWeatherReview, 2014) Atmospheric reanalysescan however be used for studying the large scale circulation associated with development of PLs
Large-scaleAtmospheric Circulation For Polar LowDays Composite standardized anomalies of Z500, SST-T500, PV300 and winds (ERAI) and significanceduring cold season for PL days Z 500 hPa SST-T500 • PL formation when: • Negativegeopotentialheight (Z500) • Large instability (SST-T500 positive) • Stratospheric intrusion at lower tropopause (PV 300 positive) • Northerlywinds at 925 hPa • Anomalies last 8-10 days Winds 925 hPa PV 300 hPa (Mallet et al , JGR Atmosphere, 2013)
Formation Areas of PLs Most of Plsformalong the Norwegian Atlantic Current and other warm oceaniccurrents ~25% of PLsform at the edge of seaiceduring 1999-2013 period (Rojo et al, Tellus A, 2014 in revision)
Formation of Polar Lows in Large SST gradient : An Example 06:12 21/02 02:32 23/02 SST and SIC on 21/02/2012 fromOSTIA (Operational SST and SIC Analysis) ERA-I winds at 925 hPa at 22/02/2012 Example of polar low(21/02/2012) whichformed at the edge of seaice and lasted 2 days Start in the NorwegianSea and end in the Barents Sea Formation in high SST gradients. Trajectoryfollowedwind direction at 925 hPa.
Connexion BetweenSeaIce And Formation of Polar Lows A single case of Polar Lowobserved16 January2009 over Kara Seaduring 1999-2013 period A single case of Polar Lowobservednorth of Svalbard, 8 January 2010 SeaIce (NOAA-17 MOZAIKK 2009-01-16 17:40, polarlow.met.no/stars/) Courtesy of Gunnar Noer, Norv Met Institute
Influence Of Mid-Winter Barents Sea SIC On Polar Low Formation In March • Observations : • 0 PL in March 2007 • 13 PL in March 2013 Whythisdifference?
Influence Of Mid-Winter Barents Sea SIC On Polar Lows Formation in March SI- - SI+ SI- - SI+ Differencesbetweencomposites of SST, SST-T500, Z500 and winds in March for the yearswithnegative anomalies of SIC (SI-) in January/February and yearswith positive anomalies (SI+) (lag of about 2 months) For negative anomalies of SIC in January/February, atmospheric conditions are favorable to PL developments in March over the Barents Sea. (Mallet, 2013 PHD) (Mallet, 2013)
Influence Of Winter Barents Sea SIC On Polar LowFormation At The End of The Season SIC january 2007 SIC january 2013 Analysis of SIC in January Strongnegative anomalies of SIC in January 2013 compared to 2007 over Barents Sea Favorable conditions for formation of PLs PLsmarch 2007 PLsmarch 2013 SIC mapsfrom OISST data sets (NOAA Optimum Interpolation Sea Surface Temperature V2)
Temporal Distribution Of Polar Lows Over NordicSeas (Rojo, M.) Decrease of Polar Lows occurrences in NDJ Whatis the impact of the Arcticsummerseaiceextent on the early/mid-winter occurrence of polar lows?
Influence Of ArcticSummerSeaIceExtent ftp://sidads.colorado.edu/DATASETS/NOAA/G02135/Sep/N_09_area.txt Arcticseaiceextent anomalies in September for 1979-2013
Influence Of SummerSeaIceExtentOn Large Scale Circulation In Mid-Winter In December Z 500 hPa Correlationbetween SIC extent index in September and Z500, PV300, winds and SST-T500 in December For positive anomalies of SeptemberSI extent, atmospheric conditions allowformation of PLs over the nordicseas SST-T 500 hPa Winds 925 hPa PV 300 hPa
Conclusions • Wehave observedthat a large part of polar lowsdevelopalongrelatively warm oceaniccurrents. Nevertheless 25% of themdevelop at the edge of seaicewhereSST gradient ishigh. • Polar Lowsdevelop over open water areas. The retreat of seaice the last years opens new areas of polar low formation. • Reducedseaice over the Barents Sea in mid-wintercreates more favorable conditions for PL development at the end of the season. • Arcticseaicedecline at the end of summermay have impact on the loweractivityobserved in early/midwinterduring the last years.
Work in progress • The associations are investigated in climate simulations : • ECHAM5/MPI-OM (1.875°-1.5° resolution) SIC A1B-20C SST-T500 A1B-20C • Comparison of SIC and SST-T500 in NDJFM between 2 scenarios of ECHAM5/MPI-OM: • A1B (2070-2099) • and 20C (1970-1999) • Similarfeatures, more or lessmarked, for the 3 scenarios (B1, A1B, A2) : • Large retreat of SIC to the north • Increasedstability over the north Atlantic Ocean • Northward shift of favorable regions for polar low formation
Thanks for your attention
Influence Of Winter SIC/SST On Polar Lows SST • Observations : • 0 PL in March 2007 • 13 PL in March 2013 • Whythisdifference? • Analysis of SST/SIC in February • Strongnegativeanomaly of SIC in February 2013 • Positive SST anomalies predominant February 2013 February 2007 SIC Standardized anomalies of SST/SIC using ERAI ERAI database, resolution 0.75°x0.75° Anomaly = (SST (/SIC) March 2007(/2013) - mean SST (/SIC) March 79-13)/ standard deviation
Influence Of Winter SeaIce On Polar Lows Standard anomalies of SST/SIC using ERAI ERAI database, resolution 0.75°x0.75° Anomaly = (SST (/SIC) March 2007(/2013) - mean SST (/SIC) March 79-13)/ standard deviation SST • SST : • Strong positive anomalies in March 2007 • Colder SST in March 2013than in February due to several cold air outbreaks • SIC : • Negative SIC anomalystronger in March 2007 than in February • Formation of seaicebetweenFebruary and March 2013 over the Barents Sealikely due to several cold air outbreaks March 2007 March 2013 SIC
Monthly Anomalies Of SST Between 2013 & 2007 Using OISST Use of OISST database, monthly data, resolution 1°x1°, since 1982 SST Jan 2013 - SST Jan 2007 SST Feb 2013 - SST Feb 2007 January and February 2013 : SST warmer March and April 2013 : SST colder SST Apr 2013 - SST Apr 2007 SST Mar 2013 - SST Mar 2007
Monthly Anomalies Of SIC Between 2013 & 2007 Using OISST SIC Jan 2013 - SIC Jan 2007 SIC Feb 2013 - SIC Feb 2007 January and February 2013 : less SIC around Svalbard and at West of NovayaZemlya March and April 2013 : more SIC at North and East of Barents Sea SIC Mar 2013 - SIC Mar 2007 SIC Apr 2013 - SIC Apr 2007
Atmospheric Situation In March 2007 SST-T500 ERAI PV 300hPa ERAI Wind 925 hPa ERAI LHF NCEP SHF NCEP T (K) Warm winds ~ 270 K from SW prevent the development of PL No stratospheric intrusion thatcould trigger PL development Low SST-T500 < 37 K (indicator of convective troposphericheatingdriven by surface fluxes/staticstability) Weak turbulent flux : LHF < 90 W.m-2, SHF ~ 50 W.m-2
Atmospheric Situation In March 2013 PV 300hPa ERAI SST-T500 ERAI Wind 925 hPa ERAI SHF NCEP LHF NCEP T (K) Cold winds ~ 255 K from NE allow formation of seaice at North and East of Barents Strong signature of PV anomaly > 50 pvu at SE of Barents Strong SST-T500 > 47 K at North of Norway, where PL form Weak turbulent flux : LHF > 115 W.m-2, SHF ~ 250 W.m-2
Case Study Of Several Polar Lows • Analysis of several cases of long duration Polar Lows : 2008-04-04, 2012-04-04, 2012-02-21 • Study of SST, SIC and atmosphericparameters • Exceptional case in Kara Sea in 2009-01-16
DecemberSeaIceExtent Over The Barents Sea Large Interannualvariability
Influence Of SummerSeaIceExtentDetrend In December SST-T 500 hPa Z 500 hPa PV 300 hPa Winds 925 hPa
Influence Of SummerSeaIceExtentDetrend In January SST-T 500 hPa Z 500 hPa PV 300 hPa Winds 925 hPa
The research leading to these results has received funding from the European Union 7th Framework Programme (FP7 2007-2013), under grant agreement n.308299 NACLIM www.naclim.eu