Download
1 / 28
320 likes | 474 Views
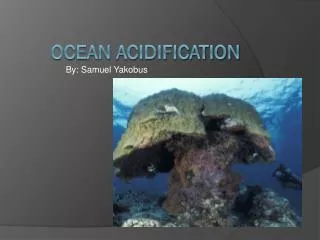
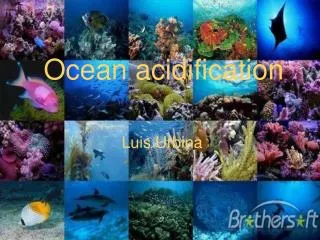
Ocean Acidification. Reid Bergsund and Catherine Philbin. 9.7 Billion Metric Tonnes per Year of Anthropogenic Carbon Emissions in 2012. Global Greenhouse Gas Emissions by Source. Anthropogenic emissions are the result of human combustion of fossil fuels

E N D
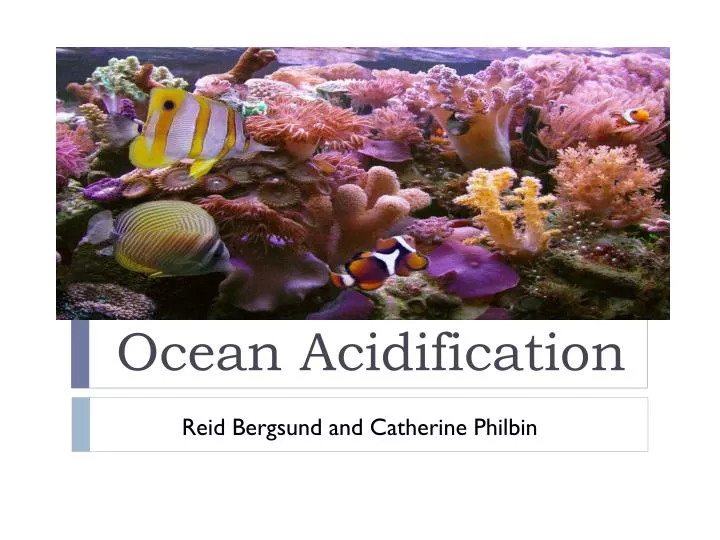
Ocean Acidification Reid Bergsund and Catherine Philbin
9.7 Billion Metric Tonnes per Year of Anthropogenic Carbon Emissions in 2012 Global Greenhouse Gas Emissions by Source • Anthropogenic emissions are the result of human combustion of fossil fuels • Anthropogenic carbon emissions grew 2.1% since 2011
Balance of carbonate species shifts right from CO2 to HCO3- and CO3- • Ocean absorbs about 1/3 of excess atmospheric CO2 • The addition of CO2 to seawater causes the formation of carbonic acid • CO32- decreases with increasing levels of CO2 • Carbonic acid then undergoes two dissociations and releases H+ ions into the ocean, causing ocean pH to decrease CO2 (g) ⇔ CO2 (aq) CO2 dissolves in ocean water CO2 + H2O ⇔ H2CO3 CO2 and H2O form carbonic acid H2CO3 ⇔ HCO3- + H+ The first dissociation HCO3- ⇔ CO32- + H+ The second dissociation pH = -log10[H+] The pH is determined by the concentration of H+ ions
The Carbonate Buffer System Helps to Maintain Equilibrium • CO2, HCO3- and CO32- make a carbonate buffer system • The addition of CO2 will cause the equilibrium equation to move to the right. • An increase in CO2 decreases CO32- in order to maintain chemical equilibrium CO2 + CO32- + H2O ⇔ 2HCO3- Equilibrium reaction for CO2 in seawater
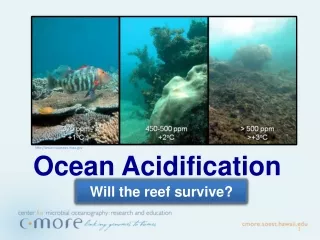
An Increase in Atmospheric CO2 Causes a Decrease in the Supersaturation levels of CaCO3 • Surface waters are supersaturated with CaCO3 • The decrease in CO32- caused by an increase in CO2 results in less abundant dissolved CaCO3 • Corals produce CaCO3 more slowly as ocean pH and CaCO3supersaturation levels both decrease Ca2++ CO32- ⇔ CaCO3 Calcification reaction Healthy Coral Reef Reef after ocean acidification? Coral with Calcite shells
Iglesias-Rodriguez et al (2008) Argue that Rising Atmospheric CO2 Partial Pressures Won’t Reduce Marine Organism Calcification • Grew cultures of Emilianiahuxleyicoccolithophores (photosynthetic plankton) • Bubbled different partial pressures of CO2 through cultures ranging from 280 ppmv (pre-industrial levels) to 750 ppmv (end of 21st century worst case scenario) E. huxleyicoccolithophore
E. huxleyiis the Most Abundant Species of Coccolithophore • Found in temperate, subtropical, and tropical oceans; forms base of large proportion of marine food webs • E. huxleyi’s abundance and importance is the reason it’s often used for studies of this nature Relative abundance of different species of Coccolithophore
Coccolith Volume Changed During Experiments at Different CO2 Levels • Coccolith volume and CaCO3 levels generally increase with rising CO2 partial pressures • Discovered that coccolith calcification increased under higher-CO2 conditions
Experimental Results Show Coccolith Productivity Rising with Increased pCO2 • Particulate Inorganic Carbon (PIC), Particulate Organic Carbon (POC): suspended, particulate inorganic and organic carbon species produced by phytoplankton at the sea surface • PIC (graph A) levels and POC (graph B) levels double at 750 ppmv CO2 • PIC production rates (graph C) and POC production rates (graph D) double at 750 ppmv CO2 Different colored dots represent different independent experiments CO2ppmv CO2ppmv
Experimental Results Show Coccolith Growth Rates Decreasing with Increased pCO2 • If the range of experiments is viewed as providing error bars, the experiments are consistent with each other Different colored dots represent different independent experiments
Field Observations Confirm Upward Trend in Coccolith Mass Witnessed in Experiments • Change in coccolith mass has accelerated over recent decades • Increase in average coccolith mass correlates with rising atmospheric CO2 Atmospheric CO2 data taken from Siple ice core and Mauna Loa Observatory
Riebesell et al (2008) Argue that Experimental Protocol is Flawed • Particulate Inorganic Carbon production rates and Particulate Organic Carbon production rates don’t increase when normalized to Particulate Organic Carbon biomass for E. huxleyicultures under different CO2 partial pressures PIC Production Rates POC Production Rates Different colored dots represent different independent experiments
Riebesell et al (2008) describe specific procedural oversights in Iglesias-Rodriguez et al (2008) experiments • E. huxleyiprecultures were grown at 5x-10x natural cell density, affecting cell carbon levels • E. huxleyiprecultures may have experienced nitrogen limitation during transfer to experimental flasks • Nitrogen limitation in E. huxleyi increases cell size and carbon levels • Experimental incubations only lasted 1.5 to 3 days; only 1 to 2 cell generations • With only 2 generations, differences in carbon quota, cell growth rates could be attributed to preconditioning, not CO2 differences E. Huxleyicultures, magnified Procedural errors could have driven cell growth rate and carbon levels artificially high
Iglesias-Rodriguez et al (2008) argue that experiments accurately depicted ocean conditions • Alkalinity is the capacity of an aqueous solution to neutralize an acid • Due to the long residence time of alkalinity in the ocean, alkalinity was held constant in the experiment, contrary to what Riebesell et al (2008) suggest • CO2 bubbling mimics the ocean alkalinity and the changes in the biocarbonate ion of high CO2 seawater
ALOHA Data Shows that the Surface Ocean pH has Decreased as Atm CO2 and pCO2 has Increased • Oceanic uptake of CO2 is a cause for increases in DIC and decreases in CaCO3 saturation • Since preindustrial age, atmospheric CO2 and the pCO2 in the ocean have increased, whereas pH has decreased by 0.1 units Red:atmospheric CO2 at Mauna Loa in ppmvBlue: surface ocean pH Tan: pCO2inμatmin the subtropical North Pacific Ocean
Aragonite is a More Soluble Form of CaCO3 than Calcite The crystal structure of Calcite The crystal structure of Aragonite
Aragonite and Calcite Saturation Levels Mirror Changes in Total CaCO3 • Coral reefs are defined by the ability to produce a net surplus of CaCO3 • In the last 17 years the saturation of both calcite and aragonite have both decreased Blue: saturation of aragonite Gray: saturation of calcite
Calcite and Aragonite Saturation Levels Have Gotten Less Deep in the Ocean since Preindustrial Times • Saturation levels of aragonite and calcite are based on temp, pressure, and pH • Above the saturation levels, calcite and aragonite tend to form crystal structure • Saturation levels at present (solid) have changed since preindustrial times (dashed) Latitude
Saturation Levels of Aragonite and Calcite Vary Across Different Oceans • Anthropogenic CO2 penetration is highest in the N. Atlantic because of deep water formation • Saturation levels of Calcite and Aragonite change most where CO2 has penetrated
Organisms Lose Calcite Shells in More Acidic Seawater • Degree of sensitivity to ocean acidification varies between species • Chronic exposure is difficult to demonstrate in laboratories • Calcification rates decrease as ocean pH and aragonite and calcite saturation states decrease • Some corals completely lose their skeletons when grown in highly acidic water Coral grown for 12 months in: (a) pH = 8.2 and (b) pH = 7.4
Varied Responses to Acidification Across Different Species • Calcification, photosynthesis, nitrogen fixation and reproduction were studied across different species • Ocean acidification has widely varied affects on different biological processes Columns a-d represent linear positive, linear negative, level, and parabolic responses to increasing seawater pCO2
Global Warming Causes a Change in Nutrient Availability • Species, such as phytoplankton, are dependant on nutrient rich waters • Global warming increases thermal stratification of the upper ocean, and decreases nutrient upwelling Nutrient rich water is cold and deep, and is eventually pushed to the surface. This is the process of upwelling.
Ocean Acidification Impacts Food Webs and Ecosystems • Calcified structures provide protection from predators • With acidification, calcifiers will need to adapt, or be adversely affected • Organic matter grown at high CO2 levels have higher carbon/nitrogen ratios, affecting food quality for microbial consumers • Acidification isn’t the only effect of a changing climate, so it is difficult to predict outcomes of ocean acidification on food webs Phytoplankton are at the base of the oceanic food web
Oceanic CaCO3 Budget Affects Carbon Uptake • There are many uncertainites in the impact of increasing CO2 levels on the global CaCO3 budget • Decreasing CaCO3 saturation states cause increasing dissolution rates • If all carbonate production stops, atmospheric CO2 would decline 10-20 ppmv • Uptake rate of anthropogenic CO2 could overwhelm the natural carbonate buffer system CaCO3 flux estimates for the ocean
Chemical Speciation in Seawater Changes with Ocean pH • Weak acid species will undergo speciation changes with acidification, ex: boron, phosphorous, silicon, nitrogen • These changes can affect bioavailability • More research is needed to understand effects of ocean acidification on trace metals and organic mater Changes in phosphoric acid speciation due to changes in pH
Ocean acidification will definitely occur, but how will the oceanic ecosystems respond?
A descriptive title • yellow: … • red: … • Black: … • caption, explaining exactly what’s shown in the figure including both axes and all lines, etc • A brief take home message. Everything on slide in 24 points or larger