Download
1 / 9
90 likes | 249 Views
Demand for Water. q uantity. price. Pseudo R2=0.857. Sampling Distribution. Sampling Distribution of the OLS Estimators. Draw another random sample of smokers . New estimate of. Drawing repeated samples of smokers. Sample of s. Drawn from the sampling distribution of.

E N D
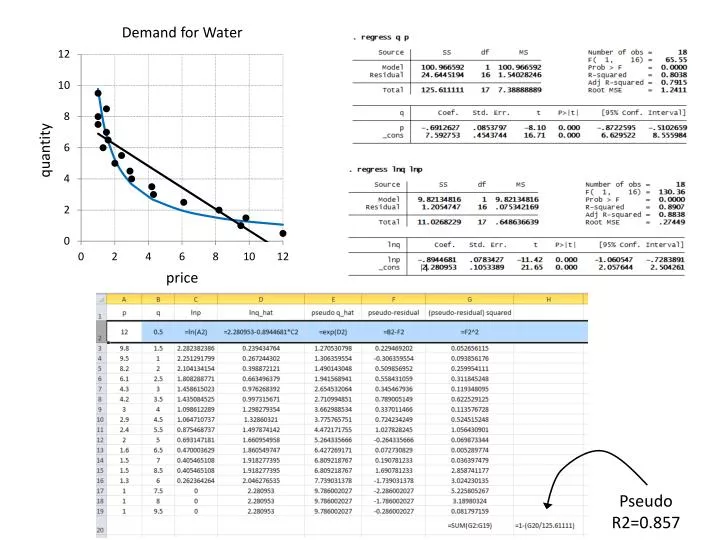
Demand for Water quantity price Pseudo R2=0.857
Sampling Distribution Sampling Distribution of the OLS Estimators Draw another random sample of smokers New estimate of Drawing repeated samples of smokers Sample of s Drawn from the sampling distribution of If the least squares assumptions are valid then, that is, the OLS estimate of is unbiased.
If the least squares assumptions are valid and the sample size is large then is normally distributed with a mean of and a variance of You can derive this formula by taking the variance of assuming that E() = 0, which is a trivial assumption.
Sampling Distribution If the least squares assumptions 1-6 are valid and the sample size is large then is normally distributed with a mean of and a variance of 68% of the area is within
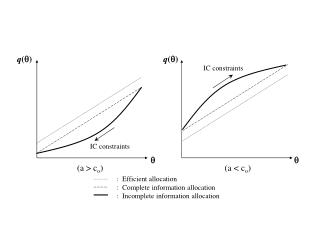
Distribution A Distribution B Would you rather draw your estimate of from a sampling distribution that looked like A or B? The variance of ↓ with ↑ in the variance of the explanatory variable. ↑ with ↑ in the variance of the error term, usually ↓ with ↑ in the sample size.
Question: What was the value of the storm warnings issued by the National Weather Service in its first decade and a half? Time-Series Data—variation in variables over time Would this have seemed like a “sure bet” as a research project?
Promising Research Project? Pluses: 1. Clever and Interesting Topic 2. Variance of the explanatory variable of central interest (SWarn) is large. Suppose it had looked like: Ship and Cargo Losses ($ per year) Ship and Cargo Losses ($ per year) Storm Warning Stations (#) ^ Storm Warning Stations (#) 3. Natural Experiment in 1883 Embezzlement scandal led to drastic budget cuts.
Promising Research Project? Minuses: Ship and Cargo Losses ($ per year) 1. Small Sample Size (T=15) It is questionable whether you can assume that is distributed normally and the is likely to be large. 2. Variance of is relatively large, also potentially contributing to a relatively large . Will it be possible to reduce its size using control variables? Storm Warning Stations (#) I would have probably chosen not to have pursued this research project. I would have been wrong since it is a nice paper and resulted in a prestigious publication.