Download
1 / 28
280 likes | 289 Views
Poverty-Growth Links. Applied Inclusive Growth Analytics Kenneth Simler and Roy Katayama (PRMPR) March 24, 2009. Overview. Importance of poverty-growth analytics Poverty-growth-inequality triangle Website: “Measuring growth-poverty links” 5 Tools Uganda example Application to Zambia case

E N D
Poverty-Growth Links Applied Inclusive Growth Analytics Kenneth Simler and Roy Katayama (PRMPR) March 24, 2009
Overview • Importance of poverty-growth analytics • Poverty-growth-inequality triangle • Website: “Measuring growth-poverty links” • 5 Tools • Uganda example • Application to Zambia case • Summary
Importance of poverty-growth links • General consensus that: • Poverty reduction is meaningful goal of development • Growth is necessary for sustainable poverty reduction • However, the extent to which growth translates into poverty reduction varies across countries. • Benefits of growth may not be trickling down • Distributional changes can offset growth effects
10 Romania Zambia Indonesia Annual change in poverty headcount (%) Burkina Faso -3 6 Bolivia Senegal Bangladesh Brazil India Tunisia Ghana Uganda El Salvador Vietnam -10 Annual GDP per capita growth, 1990s (%) Source: Pro Poor Growth in the 1990s. Country Case studies Growth-poverty link
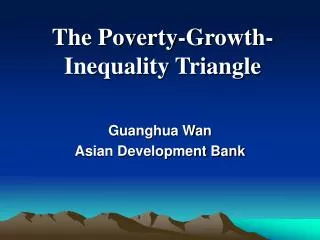
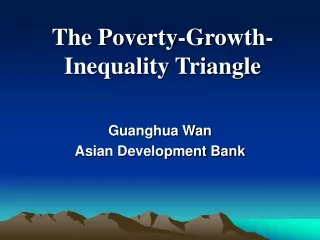
Poverty-growth-inequality triangle • Poverty reduction= f (growth, Δdistribution) • What are effects of growth on distribution? • What are effects of inequality on rate and pattern of growth? Source: Bourguignon (2004)
Poverty-growth-inequality triangle Source: Bourguignon (2004) • Ex-post analysis of this relationship can: • Inform ex-ante analysis of poverty and distributional impacts of policies • Help policymakers in evaluating policy options
Looking beyond averages • Inclusive growth analysis requires: • Good understanding of growth at the mean, • …but also the incidence of growth across the distribution, • ... and changes to the distribution and poverty. • Review of ESW indicated: • Many could have been strengthened by utilizing existing tools on growth-poverty links.
Overview of website and contents Website: “Measuring the Growth-Poverty Link”
Useful growth-poverty tools • Website:Measuring the Growth-Poverty Link (http://go.worldbank.org/J70VTQSAK0) • Purpose: • Make tools that explore poverty-growth links more accessible and results easier to understand • 5 existing “tools” to explore growth, distribution, and poverty • Growth elasticity of poverty • Growth incidence curve • Rate of pro-poor growth • Growth-Inequality decomposition of poverty • Sectoral decomposition of poverty
Overview of each “tool” on website • Definitions and Concepts • Limitations and Extensions • Quick Results • Data requirements • Stata/ ADePT options • Helpful tips • Annotated examples • Stata commands • Interpretation of results • References / Related Papers
With examples from Uganda case 5 tools
1. Growth elasticity of poverty • Indicates how effectively growth has translated into poverty reduction. • Misnomer: • Should be GDP elasticity of poverty • Initial conditions matter: • Location of poverty line (initial poverty levels) • Variance of the distribution (initial inequality)
2. Growth incidence curves • Illustrates growth rate of income (expenditure) for each percentile of a distribution. • Gives equal weight to people…rather than to dollars • Refers to anonymous percentiles • Individual at 10th percentile at t0 is not necessarily same individual at 10th percentile at t1
Uganda: GICs 1992-2002 2002-2005 Growth rate in mean =4.09 Mean percentile growth rate =3.26 Headcount poverty (1992) =56.43 Rate of pro-poor growth =2.90 Growth rate in mean =3.61 Mean percentile growth rate =4.73 Headcount poverty (2002) =38.82 Rate of pro-poor growth =4.44
3. Rate of pro-poor growth • Represents the mean growth rate of the poor • Not to be confused with growth rate in the mean of the poor • Related to GIC (w/ Watts index): Total growth rate of the poor divided by headcount poverty • General definition: <
4.Growth-inequality decomposition Quantifies the relative contribution of economic growth and redistribution to changes in poverty. = + +
Uganda: Growth-inequality decomp. Uganda: 1992-2002 1992 as reference (base year 1)
5. Sectoral decomposition of poverty • Quantifies relative contributions to changes in aggregate poverty of: • changes in poverty within sectors and • inter-sectoral population shifts = + + • Typical sectors for decomposition: • Urban/rural • Economic sectors • Regions
-------------------------------------------------------------------------------------------------------------------------------------------Sectoral Decomposition of a Change in Poverty: HeadCount------------------------------------------------------------------------------------------------------------------------------------------- Uganda: Sectoral decomposition • 1992-2002: sectoral decomposition of poverty by urban and rural areas
Application to Zambia Household Survey Data (1996, 1998, 2004) Zambia
Zambia:Growth Elasticity of Poverty Ln(p0) = 10.07 – 0.47 (Ln(GDP/capita)) (3.70) (2.14) Adj R2 = 0.642
Zambia: Growth Incidence Curve 1996–1998 Growth rate in mean: – 3.6 Mean percentile growth rate: – 6.0 Headcount poverty (1996): 69.2 Rate of pro-poor growth: – 7.6 Growth rate at median: – 3.8
Zambia: Growth Incidence Curve 1998–2004 Growth rate in mean: 2.4 Mean percentile growth rate: 2.1 Headcount poverty (1998): 72.1 Rate of pro-poor growth: 2.1 Growth rate at median: 1.5
Zambia: Growth Incidence Curve 1996–2004 Growth rate in mean: 0.8 Mean percentile growth rate: – 0.03 Headcount poverty (1996): 69.2 Rate of pro-poor growth: – 0.4 Growth rate at median: 0.1
Summary • Website:Measuring the Growth-Poverty Link (http://go.worldbank.org/J70VTQSAK0) • These tools provide an initial look beyond averages at the poverty and distributional impacts of growth. • However, integration with growth story is necessary to get a fuller economic picture.