Download
1 / 54
540 likes | 634 Views
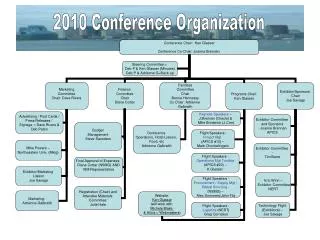
ISHC Conference - 2010. Mark Lomanno President Smith Travel Research / STR Global. Global Overview U.S. Performance Chain Scale Performance Group/Transient Performance Construction Pipeline Forecast/Takeaways. Today’s Agenda. Positive Occupancy Growth around the Globe. Canada

E N D
ISHC Conference - 2010 Mark Lomanno PresidentSmith Travel Research / STR Global
Global Overview U.S. Performance Chain Scale Performance Group/Transient Performance Construction Pipeline Forecast/Takeaways Today’s Agenda
Positive Occupancy Growth around the Globe . . . • Canada • 2009 8/10 • - 2.1% -7.6% 2.9% Europe 2008 2009 8/10 -3.6% -6.2% 5.4% USA 2008 2009 8/10 -4.6% -8.8% 5.0% • Asia Pacific • 2009 8/10 • -7.2%-6.9% 11.6% Caribbean 2008 2009 8/10 -3.9% -4.1% 1.3% ME & A 2008 2009 8/10 0.7% -10.9% -0.5% • Mexico • 2009 8/10 • -2.0%-16.1% 10.1% Occupancy % Change – Full Year 2008, 2009, August YTD 2010 2010 STR Global Limited
ADR Increases everywhere but USA and Mexico . . . . • Canada C$ • 2009 8/10 • 3.1% -5.1% 2.4% Europe € 2008 2009 8/10 -1.4% -11.2% 2.9% USA $ 2008 2009 8/10 2.7% -8.7% -1.0% • Asia Pacific $ • 2009 8/10 • 9.5% -13.5% 10.3% Caribbean $ 2008 2009 8/10 -10.2% -13.5% 4.6% ME & A $ 2008 2009 8/10 16.2% -2.7% 3.6 % Mexico P$ 2008 2009 8/10 5.2% -0.2% -9.7% ADR % Change – Full Year 2008, 2009, August YTD 2010 2010 STR Global Limited
Global RevPAR Recovers – Primarily Occupancy Driven • Canada C$ • 2009 8/10 • 0.9% -12.3% 5.3% Europe € 2008 2009 8/10 -4.9% -16.7% 8.4% USA $ 2008 2009 8/10 -1.9% -16.7% 4.0% • Asia Pacific $ • 2009 8/10 • 1.6% -19.4% 23.1% Caribbean $ 2008 2009 8/10 -14.4% -17.1% 6.0% ME & A $ 2008 2009 8/10 17.1% -13.3% 3.1% Mexico P$ 2008 2009 8/10 2.9% -16.1% -0.5% RevPAR % Change – Full Year 2008, 2009, August YTD 2010 2010 STR Global Limited
Total United StatesKey Performance Indicators Percent ChangeAugust YTD 2010
Strong Demand Rebound – Supply Slowing 4.3% 2.5% -4.7% -6.9% Total United States: Twelve Month Moving Average 1989 thru August 2010
Total United StatesMonthly Room Demand – Seasonally Adjusted1998 to August2010
102,307,179 July 2010 The Most U.S. Monthly Rooms Sold – EVER!!!
ADR Declines Accelerate In Each Downturn +0.1% -4.7% -8.9% Total United States: Twelve Month Moving Average 1989 thru August 2010
Total United StatesADR – Seasonally Adjusted1998 to August2010 $107.91 Sep 2008 $86.59 Oct 2000 $86.79 Oct 2004
Absolute ADR Will Not Recover for At Least 2 More Years 23 Months -$10.25 41 Months -$3.70 Total United States: ADR Twelve Month Moving Average 2000 – August 2010
Total United StatesOccupancy and ADR Percent ChangeYTD through 9/25
Key 15 U.S. MarketsADR Percent ChangeAugust 2010 YTD Excludes Las Vegas
Total United StatesRevPAR Percent ChangeTwelve Month Moving Average – 1989 to August 2010 - 1.8% -10.5% -16.8% 2008 Smith Travel Research, Inc.
Total United StatesRevPAR – Seasonally Adjusted1998 to August2010 $55.29 Nov 2000 $55.67 Mar 2005
Luxury – Four Seasons, Ritz Carlton, Fairmont Upper Upscale – Hyatt, Embassy, Hilton, Marriott, Kimpton Upscale – Hyatt Place, Hilton Garden Inn, aloft Hotel Mid with F&B – Best Western, Holiday Inn, Ramada, Quality Inn Mid no F&B – Hampton Inn, HI Express, Country Inn & Suites Economy – Econolodge, Red Roof, Days Inn STR Chain ScalesSelected chains from each segment
U.S. Chain ScalesSupply/Demand Percent ChangeAugust 2010 YTD
Total United StatesRooms Under Construction by Scale – ThousandsAugust 2010 60% = Upscale & Mid w/o F&B Source: STR / Dodge Construction Pipeline
U.S. Chain ScalesOccupancy/ADR Percent ChangeAugust 2010 YTD
Chain Scale ADR Compression: Threat? Opportunity? US Chain Scales: Actual ADR Peak vs. August 2010
Upper End Chain Segments Driving Demand Recovery… U.S. Chain Scales: Demand % Change Monthly thru August 2010
…And ADR Recovery U.S. Chain Scales: ADR % Change Monthly thru August 2010
Group vs. Transient Performance Transient Customer: Third party, rack rate, government rate. Group Customer: Rooms booked in blocks of 10 or more.
Transient Occupancy is back . . . . U.S. Upper Tier Hotels – 2010 data through August Upper Tier = Luxury, Upper Upscale Chains and Upper Tier Independents
Total United States – Transient SegmentRoom Demand Percent ChangeJan 2003 – August 2010
. . . . But Transient ADR is not U.S. Upper Tier Hotels – 2010 data through August Upper Tier = Luxury, Upper Upscale Chains and Upper Tier Independents
Group Occupancy Below Peak 2007 Levels . . . . U.S. Upper Tier Hotels – 2010 data through August Upper Tier = Luxury, Upper Upscale Chains and Upper Tier Independents
Total United States – Group SegmentRoom Demand Percent ChangeJan 2003 – August 2010
. . . And Group ADR Below Depressed 2009 Levels U.S. Upper Tier Hotels – 2010 data through August Upper Tier = Luxury, Upper Upscale Chains and Upper Tier Independents
Low Transient Rate will hold Group Rate Hostage US Transient vs. GroupMonthly ADR ($) - Jan 2003 – August 2010
Group Rates Lag Transient Rates by 1 to 2 Years 25 Months 18 Months * Total US, Transient & Group ADR, 12 MMA, Jan ’03 – July ’10
Active Pipeline is Emptying U.S. Active Development Pipeline - RoomsChange From Last Year
Total United StatesMarkets with Most Rooms In-ConstructionAugust 2010
Key 15 U.S. MarketsAbsolute OccupancyAugust 2010 YTD Excludes Las Vegas
Key 15 U.S. MarketsAbsolute ADRAugust 2010 YTD Excludes Las Vegas
20092010F2011F Real GDP -2.6% +2.7% +2.5 % CPI -0.4% +1.6 % +1.5% Corporate Profits -3.8% +30.0% +6.4 % Disp Personal Income +0.6% +1.4% +2.1% Unemployment Rate 9.3% 9.6% 9.3% U.S. Economic OutlookBlue Chip Economic Indicators – September 2010
Total United StatesKey Performance Indicators Percent ChangeFull Year 2009 Actual & 2010 / 2011 Forecast
Total US Room Rates Actual vs. Inflation Adjusted 2000 – 2011F If year 2000 ADR had increased by CPI each year… Note: 2010 & 2011 inflation rate forecast from Blue Chip Economic Indicators
Total United States – Recession Demand % Change12 MMADemand ChangeFrom Start of Recession, by Month
Total United States – Recession ADR % Change 12 MMAADR ($) ChangeFrom Start of Recession, by Month
Total United States – Recession Revenue % Change 12 MMARevenue ChangeFrom Start of Recession, by Month
Total United StatesChain Scale Key Performance Indicator Outlook 2010F by Chain Scale
Total United StatesChain Scale Key Performance Indicator Outlook 2011F by Chain Scale