Download
1 / 36
620 likes | 1.23k Views
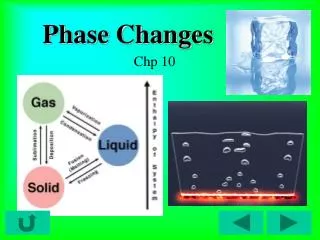
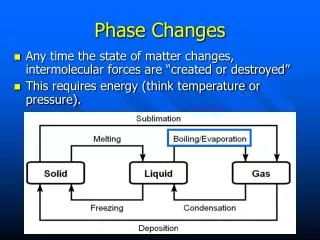
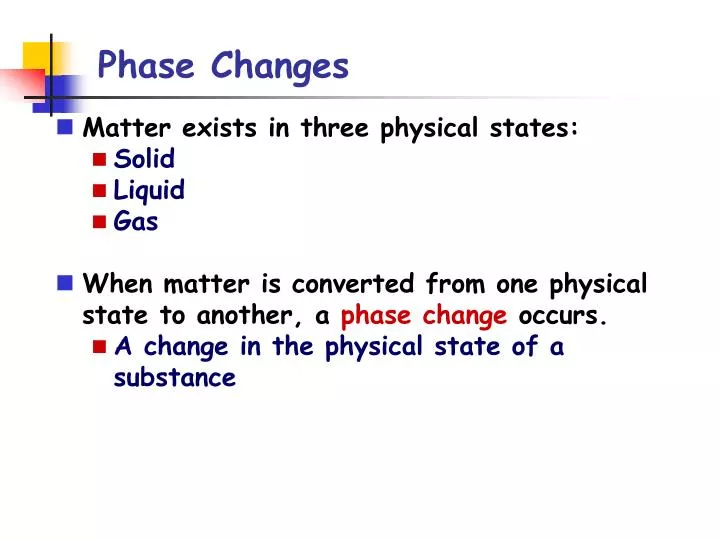
Phase Changes. Matter exists in three physical states: Solid Liquid Gas When matter is converted from one physical state to another, a phase change occurs. A change in the physical state of a substance. Phase Changes. You should know what phase change occurs for each of the following:

E N D
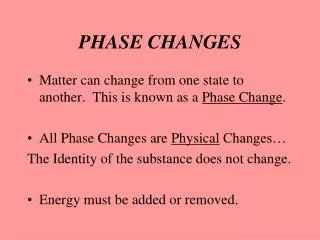
Phase Changes • Matter exists in three physical states: • Solid • Liquid • Gas • When matter is converted from one physical state to another, a phase change occurs. • A change in the physical state of a substance
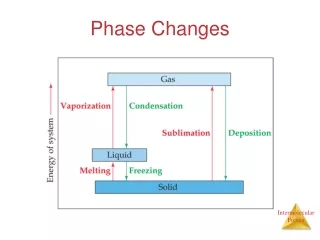
Phase Changes • You should know what phase change occurs for each of the following: • Melting • Freezing • Vaporization • Condensation • Sublimation • Deposition
Phase Changes • Melting: • Solid Liquid • endothermic • Freezing: • Liquid Solid • exothermic • Vaporization • Liquid Gas • endothermic • Condensation • Gas Liquid • exothermic
Phase Changes • Sublimation • Solid Gas • endothermic • Deposition • Gas Solid • exothermic
Phase Changes • In order for a phase change to occur, the molecules must gain enough kinetic energy to overcome the intermolecular forces between the molecules. • As the strength of the IMF increases, more energy is needed for a phase change to occur. • Higher boiling point and higher melting point occur.
Phase Changes • Every phase change is accompanied by a change in the energy of the system. • Heat of fusion (DHfus) • Enthalpy change required to change a solid at its melting point to a liquid at the same temperature • Heat of vaporization (DHvap) • Enthalpy change required to change a liquid at its boiling point to a gas at the same temperature
Phase Changes • Heat of Sublimation (DHsub) • Enthalpy change required to transform a solid directly into the gas phase • You should be able to use the heat of fusion, heat of vaporization, or the heat of sublimation and the mass (or moles) of a substance to calculate the amount of heat needed to accomplish a specified phase change at constant temperature. qphase change = DHphase change x # moles
Phase Changes & Heating Curves • During a phase change, the two phases exist in equilibrium. • At the melting point, solid and liquid phases are in equilibrium. • At the boiling point, liquid and gas phases are in equilibrium. • The heat added to the system at the melting point and boiling point goes into pulling the molecules further apart from each other (i.e. overcoming the intermolecular forces).
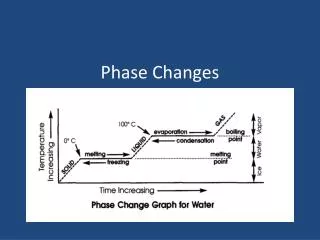
Phase Changes & Heating Curves • During a phase change the temperature of the substance is constant. • The temperature does not increase until the phase change is complete. A heating/cooling curve for water
(g, Tf) Cgas DHvap (l, BP) (g, BP) Cliq DHfus (s, MP) (l, MP) Csolid (s, Ti) Phase Changes & Heating Curves • A general heating or cooling curve for a solid below the MP being converted to a gas above the boiling point:
Phase Changes & Heating Curves • The amount of heat needed to covert a solid below its melting point to a gas above its boiling point is found by calculating the amount of heat needed for each step: qtotal = q(Ti MP) + q(sl) + q(MPBP) + q(lg) + q(BPTf) • To calculate the amount of heat needed when the temperature changes (same physical state) • q = C x mass x DT • To calculate the amount of heat needed during a phase change (temperature is constant) • q = DH x moles
Phase Changes & Heating Curves Example: Calculate the enthalpy change associated with converting 12.0 g of ice at -15oC to steam (water vapor) at 115oC under a constant pressure of one atmosphere. The specific heats of ice, water, and steam are 2.09J/g-K, 4.18 J/g-K, and 1.84 J/g-K, respectively. For water, DHfus = 6.01 kJ/mol and DHvap = 40.67 kJ/mol.
Phase Changes & Phase Diagrams • What would you do differently if the problem asked to calculate the enthalpy change to convert 12.0 g of steam at 115oC to ice at -15oC? • You should be able to handle both types of problems.
Phase Changes & Heating Curves Example: Benzene (C6H6) has a boiling point of 80.1 oC and a melting point of 5.5oC. The specific heat of benzene is 1.516 J/gK in the solid phase, 1.726 J/gK in the liquid phase, and 1.055 J/gK in the gas phase. Its heat of fusion is 9.90 kJ/mole while its heat of vaporization is 30.77 kJ/mol. Calculate the amount of heat (in kJ) needed to heat 150.0 g of C6H6 from 22.0oC to 90.0oC.
Vapor Pressure • What happens to a glass of water that is left sitting on a table for an extended period of time?
Vapor Pressure • Some of the water molecules have enough kinetic energy to escape the intermolecular forces that are “holding” them in the liquid phase. • Evaporation takes place. • In a closed container, molecules in the gas phase cannot escape, and the pressure exerted by the vapor in the “headspace” begins to increase.
Vapor Pressure • In a closed container, the liquid and vapor reach a state of dynamic equilibrium: • Liquid molecules evaporate and vapor molecules condenseat the same rate. • The vapor pressure in the container reaches a constant value. • Vapor pressure:the pressure exerted by a vapor when the liquid and vapor states are in dynamic equilibrium.
Vapor Pressure • Hotter liquids evaporate more easily because they have higher vapor pressures than colder liquids. • VP as T • Substances with higher vapor pressures are more volatile. • Volatile: • evaporates easily.
Phase Changes and Phase Diagrams Example: Which of the compounds on the previous slide is most volatile at room temperature: diethyl ether, ethyl alcohol, water or ethylene glycol? Which one has the strongest intermolecular forces? (How do you know?) What types of intermolecular forces exist in each molecule.
Vapor Pressure • At the same temperature, compounds with different boiling points will have different vapor pressures. • High BP = low VP • Low BP = high VP
Vapor Pressure & BP • Boiling point: • The temperature at which the vapor pressure of a liquid equals atmospheric pressure. • Normal boiling point: • The temperature at which the vapor pressure of a liquid equals 760.torr or 1 atm.
Phase Changes and Phase Diagrams Example: Use the graph of vapor pressure as a function of temperature to predict the normal boiling point of diethyl ether and its approximate boiling point at 400 torr and at 1000 torr. Normal BP = BP @ 200 torr = BP @ 1000 torr =
Phase Changes and Phase Diagrams Example: Bromine has a normal boiling point of 332.0K while iodine has a normal boiling point of 457.6K. Which is more volatile at room temperature? Which one has the weakest intermolecular forces at RT?
Phase Changes and Phase Diagrams • Dynamic equilibria can exist between other states of matter. • A phase diagram for a substance illustrates: • its physical state at various T and P • the equilibria that exist between phases
Phase Changes and Phase Diagrams • The AB line is the liquid-vapor interface. • It starts above the triple point (A) • the point at which all three states are in equilibrium.
Phase Changes and Phase Diagrams • It ends just below the critical point (B); • the temperature (critical temperature) and pressure (critical pressure) above which the liquid and vapor are indistinguishable from each other
Phase Changes and Phase Diagrams • Each point along this line (EXCEPT THE CRITICAL POINT or TRIPLE POINT) is the boiling point of the substance at that pressure.
Phase Changes and Phase Diagrams • The AD line is the interface between liquid and solid. • The melting point at each pressure can be found along this line (excluding the triple point).
Phase Changes and Phase Diagrams • Below A the substance cannot exist in the liquid state. • Along theAC line the solid and gas phases are in equilibrium • The sublimation point at each pressure is along this line (excluding the triple point).
Phase Changes and Phase Diagrams Example: Given the phase diagram for water, which point represents: • the normal boiling point of water • the normal melting point of water • the critical point of water • the triple point of water
Phase Changes and Phase Diagrams Example: Given the phase diagram for carbon dioxide, which line represents the equilibrium between: • Solid and liquid? • Liquid and gas? • Solid and gas?
Phase Changes and Phase Diagrams Example: Using this phase diagram for water, describe the changes in physical state that occur when water is maintained at 0oC while the pressure decreases from that at point 5 to that at point 1. 5: 4: 3: 2: 1:
Phase Changes and Phase Diagrams Example: Using this phase diagram for water, describe the changes in physical state that occur when water is kept at 1 atm pressure while the temperature decreases from that at point 9 to that at point 6. 9: 8: 7: 4: 6: