Download
1 / 38
380 likes | 547 Views
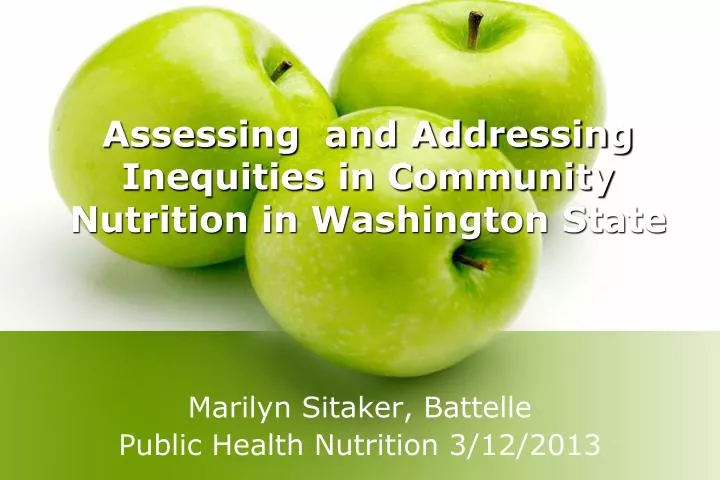
Assessing and Addressing Inequities in Community Nutrition in Washington State. Marilyn Sitaker, Battelle Public Health Nutrition 3/12/2013. Health Equity is the absence of differences in health between groups with greater and lesser levels of social advantage

E N D
Assessing and Addressing Inequities in Community Nutrition in Washington State Marilyn Sitaker, Battelle Public Health Nutrition 3/12/2013
Health Equity is the absence of differences in health between groups with greater and lesser levels of social advantage Health equity is necessary for individuals & groups to participate in, and benefit from, social and economic development. Health equity is a conscious process requiring effort What is Health Equity?
Today’s Lecture Topics • Dimensions of inequalities in access to healthy foods • What we know about health inequities • WHO Health Equity conceptual model • Measuring health equity • Policy intervention strategies
Inequitable nutrition environments • The high-fat, high-salt, and low-vegetable/fruit diets found in disadvantaged populations are often less the result of bad choices than the unfortunate consequence of the shrinking number of good, affordable supermarkets in inner-city neighborhoods, the explosion of fast food restaurants in urban areas, and food traditions originating in deprivation.[1] [1] Amersbach,G. Through the lens of race: Unequal health care in America. Harvard Public Health Review, Winter 2002. Viewed 3/5/2006. http://www.hsph.harvard.edu/review/review_winter_02
1. Access to healthy food is challenging for many, particularly in low-income and rural areas, and in communities of color Urban U.S. Food-store Availability by Income, Mean Number per ZIP Code • Lack of supermarkets • Lack of healthy, high quality foods in nearby food stores. • Too many convenience & liquor stores. • Lack of transportation access to stores Powell et al, Am J of Prev Med , 44(3): 189–195, March 2007.
2. Residents with greater access to supermarkets & availability of healthy food options eat more fresh produce • For each additional supermarket in a census tract, produce consumption increases by 32% for African Americans and 11% for whites, according to a multistate study. • A survey of produce availability in New Orleans’ neighborhood stores found that for each additional meter of shelf space with fresh vegetables, residents eat an added 0.35 servings per day. • In rural Mississippi, adults living in “food desert” counties lacking large supermarkets are 23% less likely to eat enough fruits and vegetables than those in counties that have supermarkets, controlling for age, sex, race, and education.
“Reaching for a Healthier Life”Facts on Socioeconomic Status & Health in the US February 2010 Volume 1186 The Biology of Disadvantage: Socioeconomic Status and Health Pages 1–275 http://www.macses.ucsf.edu/downloads/reaching_for_a_healthier_life.pdf
1. Socioeconomic status has a big impact on everyone’s health. Premature death is 3 x more likely for those in poverty compared to those who are most privileged
2. Access to socioeconomic resources affects our chances for living a healthy life. The conditions we live in during childhood drives many health problems
2. Childhood living conditions influences health as we age. Throughout our lives, access to socioeconomic resources affects our chances to live a healthy life.
3. Health care is important, but accounts for only a small portion of health disparities. Social determinants are more important in determining whether we fall ill in the first place. Source: McGinnis JM, et al., Health Affairs, 2002
“Reaching for a Healthier Life”Facts on Socioeconomic Status & Health in the US • Each step up the social ladder provides greater access to social and physical environments that make it easier to engage in healthy behaviors, (e.g., safe places to walk and access to healthier foods). Each step down, greater exposure to potential risks (pollution & unsafe neighborhoods). • Work conditions contribute to health & health disparities. Low-wage jobs may involve shift work and physical hazards, low control over how and when tasks are done, job insecurity, and conflicts between family obligations and work requirements • Exposure to extreme and prolonged “toxic” stress is more common lower on the social ladder. Persistent stressors--financial insecurity, interpersonal disputes, work-induced exhaustion, chronic conflict-- are recorded in the body.
How social conditions influence health equity Conceptual Model created by the World Health Organization Commission on Social Determinants of Health http://www.who.int/social_determinants/resources/csdh_framework_action_05_07.pdf
Disparities in Smoking Prevalence by Income We compare the size of the disparity between the highest & lowest income by constructing a ratio . Dividing the percent in the lowest income group by the percent in the highest income group: The ratio of smoking is 31 ÷ 11 = 2.8
Disparities in Risk Factors, Risk Conditions, and Chronic Diseases among Washington Adults by Income
Washington State adults with the lowest incomes & education are less likely to eat enough fruit and vegetables. Washington: Disparities in Eating F&V
Example: Physical Activity and Access to Local Outdoor Recreation by Socio Economic Position The less education a person has, the less likely it is that he or she lives near a public park, playground, trail or school recreational facility. Less educated adults are also less likely to use nearby recreational facilities, & less likely to get enough physical activity.
Indicators: Directory of Social Determinants of Health at the Local Level • University of Michigan SPH project funded by the CDC. Developers had expertise in diverse areas. • Directory lists current data sets that can be used to address SDOH. Data sets organized in 12 dimensions of the social environment. • Each dimension is subdivided into various components.
12 Dimensions of Social Context Source; Hillemeier M.M., J. Lynch, S. Harper, and M. Casper. 2003. "Measuring contextual characteristics for community health." Health Services Research 38(6 part 2):1645–717.
Economic Dimension • This table presents the components and indicators of the economic dimension. Nine economic components are identified: • Income • Wealth • Poverty • Economic Development • Financial Services • Cost of Living • Redistribution • Fiscal Capacity • Exploitation Source; Hillemeier M.M., J. Lynch, S. Harper, and M. Casper. 2003. "Measuring contextual characteristics for community health." Health Services Research 38(6 part 2):1645–717.
Indicators & Measures: Income Source; Hillemeier M.M., J. Lynch, S. Harper, and M. Casper. 2003. "Measuring contextual characteristics for community health." Health Services Research 38(6 part 2):1645–717.
Harvard Geocoding Project: Measuring Socioeconomic Position (SEP) Key domains: • Occupational class: affects health via occupational hazards and income/standard of living • Educational attainment: reflects childhood SEP and future economic prospects, also knowledge & health literacy • Income & subsidies: affects standard of living • Wealth: referring to accumulated assets • Relative social ranking: “status” and “prestige” Source: Public Health Disparities Geocoding Project
Area Based Measures of SEP • Each of the previous 5 socioeconomic class domains can be assessed at multiple levels--individual, household, and area or neighborhood. • Socioeconomic data can be measured at key points in the lifecourse -- in utero, infancy, childhood, and early, middle, and late adulthood. • Composite measures combine information on more than one component variable. For example, the Townsend index consists of % unemployment, % renters, % not owning a car, and % crowding.
Comparing Two Boston Neighborhoods This one house in Beacon Hill looked like it was -- and turned out to be -- in a fairly affluent area: over 75% professionals, low poverty, high income, low unemployment, and lots of expensive homes. This economically depressed area in Boston's Chinatown, turned out to be characterized as a highly working class, poor, low income area with high unemployment and few expensive homes.
Policies to Promote Health Equity 2. Policies that Blunt Adverse Consequences 1. Policies that Affect the Ladder
Health Inequalities: Trends, Progress and Policy(Bleich et al, Ann Rev Pub health 2012 33:7-40) Trends: • Reviewed time trends in health inequalities by sex, race/ethncity and socioeconomic status in the US and UK • In the US, the gap between best and worst off groups narrowed for some health issues (e.g., life expectancy), but not others (eg., diabetes) • In the UK, the gap between best and worst off groups narrowed for some health issues (e.g., hypertension), but not others (e.g., life expectancy)
Health Inequalities: Trends, Progress and Policy(Bleich et al, Ann Rev Pub health 2012 33:7-40) Policy: • Also reviewed policies designed to address health inequalities enacted between 1980 and 2011 • Nine countries reviewed: Australia, Canada, Finland, Netherlands, New Zealand, Spain, Sweden, UK, and US • Policies categorized as information, priority-setting or action step
Health Inequalities: Trends, Progress and Policy(Bleich et al, Ann Rev Pub health 2012 33:7-40)
Paula Braveman: Thoughts on Health Inequities • Systematic differences in health or health determinants that are plausibly influenced by social policy are health inequities if they • Occur between groups with different social position • Place groups already at social disadvantage at even greater disadvantagedue to poor health • You don’t need to attribute causation or prove that a change in social policy will resolve the disparity, as long as the impact is plausible. Braveman, 2004, Health Policy and Development 2(3) 180-185
Thank You! Marilyn Sitaker, MPH Principal Research Scientist Battelle Memorial Institute (206) 528-3365 Sitakerm@battelle.org